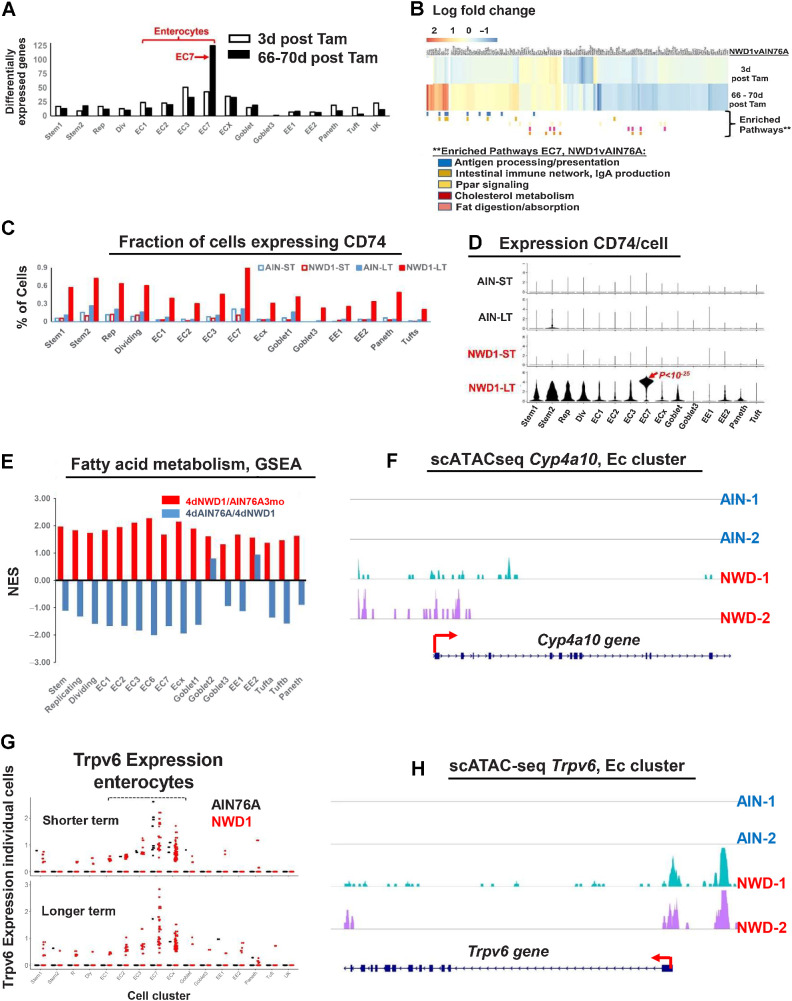
Figure 6.
NWD1 reprogramming and adaptation of cells: A, number of differentially expressed genes (>50% and P = 0.01) in Bmi1 cell clusters of Supplementary Fig. S6B. B, Heatmap of genes differentially expressed by diet in EC7 cells and cell pathways enriched (GSEA) as a function of diet in Bmi1+ EC7 cells longer term after marking of Bmi1+ cells (statistical analysis in text). C, Fraction of cells in each cluster expressing CD74. D, CD74 expression per cell, in each cell cluster as a function of diet and time after marking of Bmi1+ cells. E, GSEA for each cell cluster for the fatty acid metabolism pathway in the rapid dietary cross-over experiment (Fig. 3A)—red bars, pathway change in mice fed AIN76A for 3 months, then switched to NWD1 for 4 days before sacrifice; blue bars, the mice then switched back to AIN76A for 4 more days. F, scATAC-seq data for Cyp4a10 in enterocytes. G, scRNA-seq data for Trpv6 Bmi1+ derived cells from AIN and NWD1 fed mice 3 days or 66–70 days after cells were marked (Fig. 4A). H, scATAC-seq data for Trpv6 in enterocytes for mice fed either AIN76A or NWD1 for 4 months from weaning. For each of the diet-time point groups analyzed in A–D, F, and H,N = 2 mice for each diet-time point group; for E,N = 3 mice per group.

