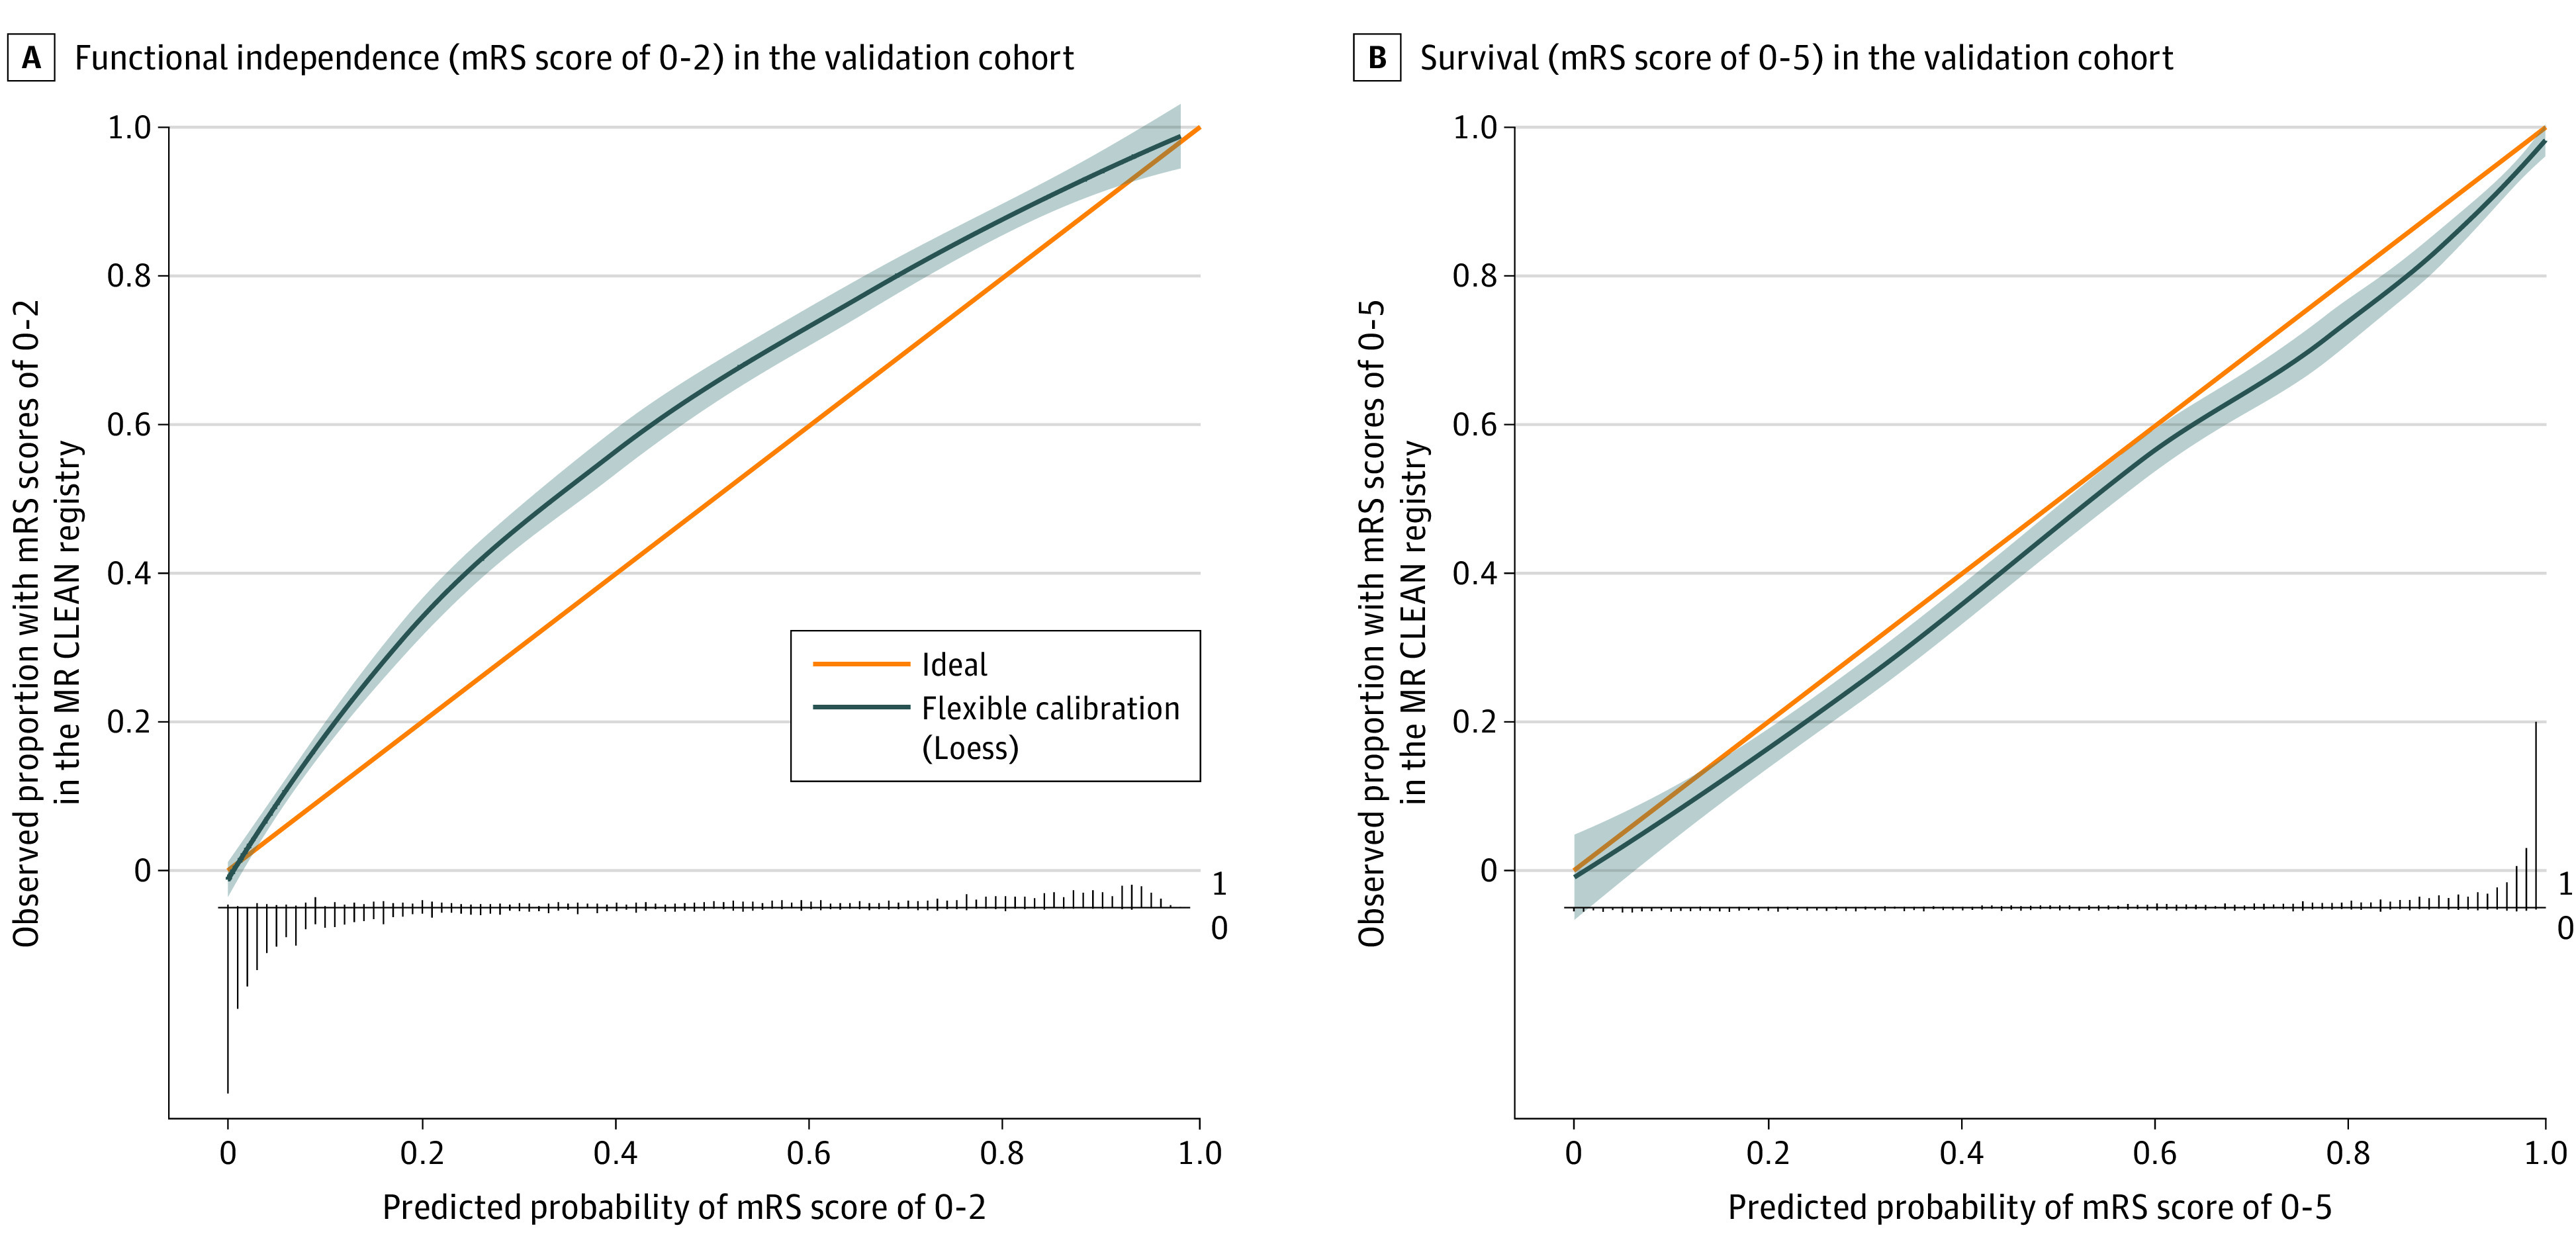
Figure 1. Calibration Plots.

A, Functional independence (modified Rankin Scale [mRS] score, 0-2) in the validation cohort. The overall observed proportion of patients with mRS score 0 to 2 in the validation cohort was higher than the predicted proportion using our model (41% vs 32%). The linear bar chart shows the distribution of patients with (= 1) or without (= 0) the observed outcome. B, Survival (mRS score, 0-5) in the validation cohort (n = 3260). The overall observed proportion of patients with mRS score 0 to 5 in the validation cohort was similar to the predicted proportion using our model (72% vs 75%). The linear bar chart shows the distribution of patients with (= 1) or without (= 0) the observed outcome. The shading around the flexible calibration line indicates the 95% confidence limits. MR CLEAN indicates Multicenter Randomized Clinical Trial of Endovascular Treatment for Acute Ischemic Stroke in the Netherlands.
