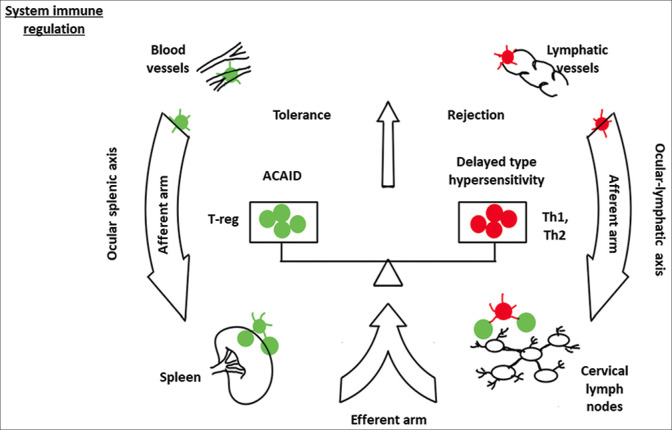
Figure 3.
Schematic diagram demonstrates the balance between immune tolerance and immune rejection. Footnotes - α-MSH: α-melanocyte-stimulating hormone; ACAID: anterior chamber-associated immune deviation; APCs: antigen-presenting cells; FasL: Fas ligand; IL: interleukin; MHC: major histocompatibility complex; TGF-β: tumor growth factor-β; TNF-α: tumor necrosis factor-α; T-reg: regulatory T cells; VIP: vasoactive intestinal peptide

