
Fig. 2. Impact of OP-TIL risk on overall survival (OS) and locoregional control (LRC).
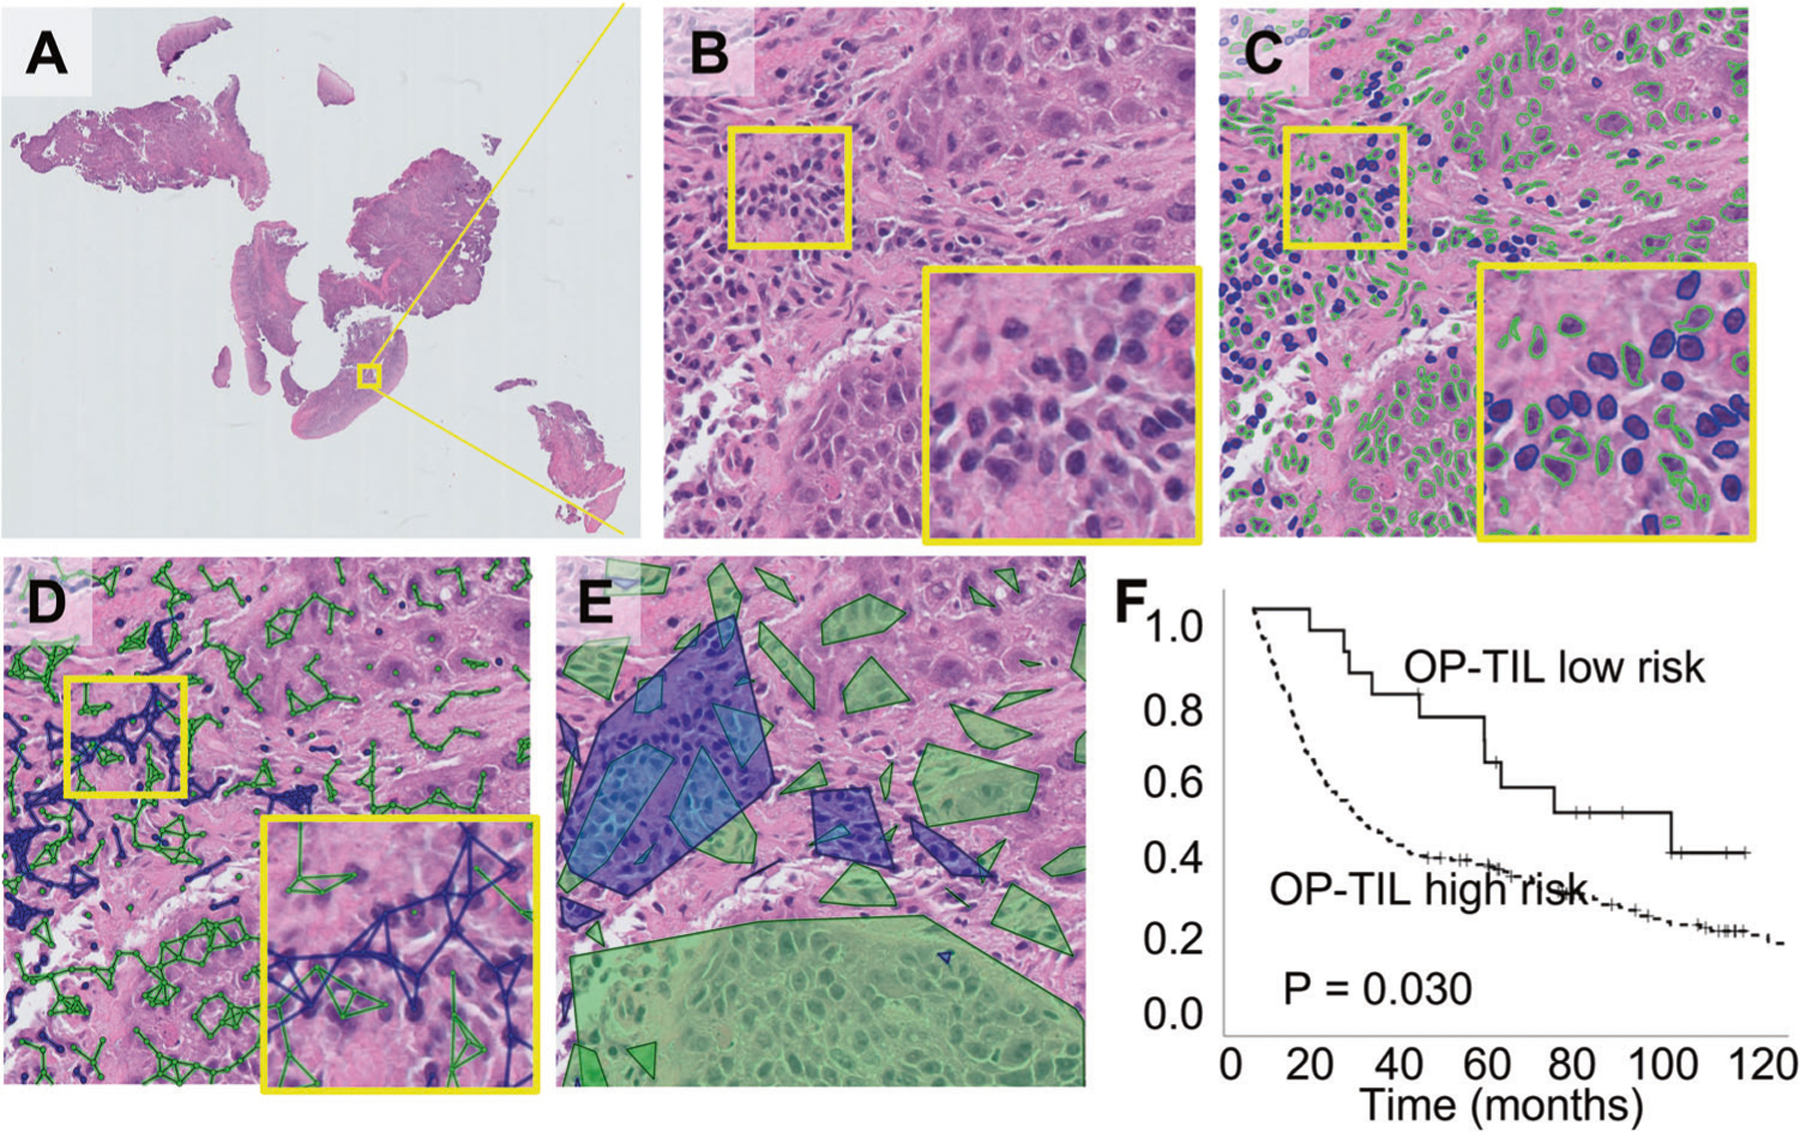
A Original H&E WSI of an OPC patient. B A representative high-power field. C Identification of cell types: TILs (blue) and non-TILs (green). D Cell subgraphs built by linking proximal nuclei of the same type. E Resulting clusters for each cell type obtained by drawing the convex hull of each subgraph. F OS analysis performed using Kaplan–Meier analysis coupled to log-rank test for the OP-TIL OS risk classifier.