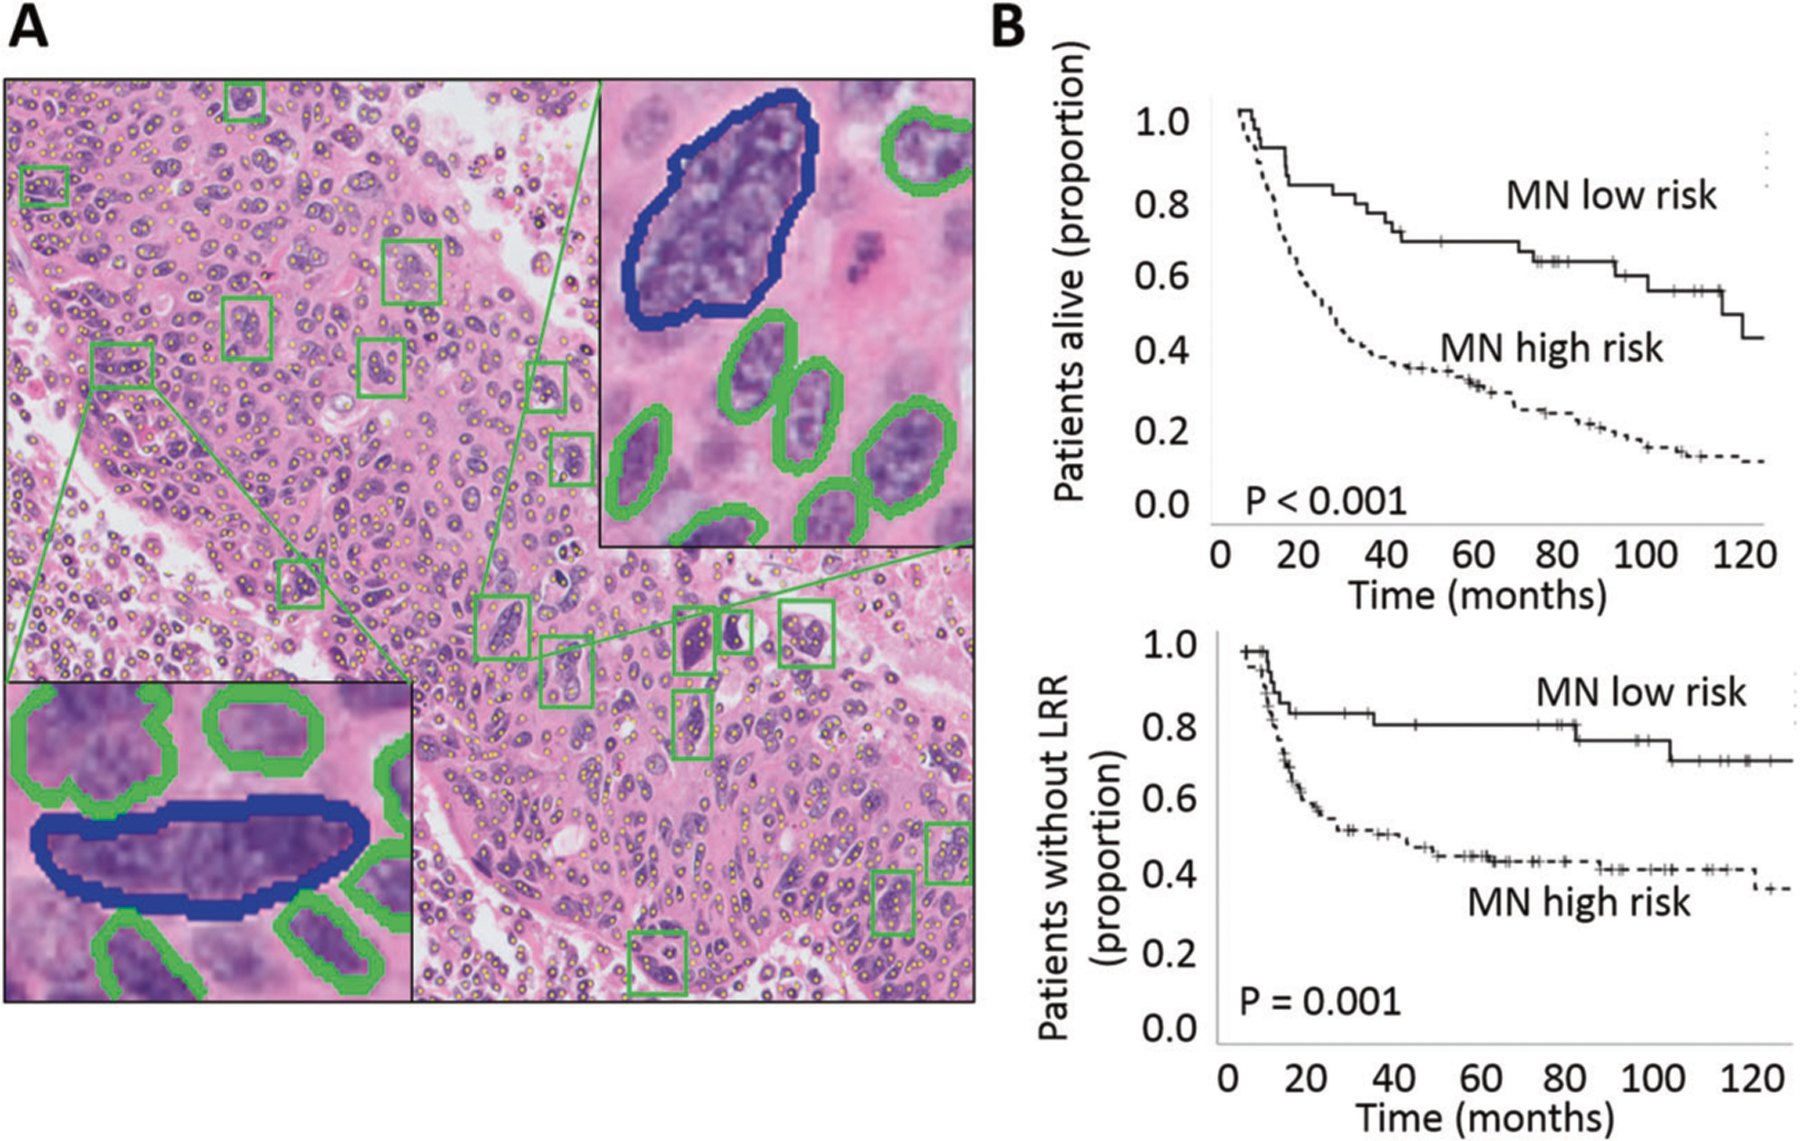
Fig. 3. Impact of MuNI on overall survival (OS) and locoregional control (LRC).

A A representative high-power field from the H&E image of an OPC patient with an overlay of automatically detected MN events by GANMN, shown by green boxes. Two of them are illustrated in enlarged views, where MN events are shown in blue and cancerous nuclei in green. B OS and LRC analysis performed using Kaplan–Meier analysis coupled to log-rank test for the MuNI risk classifier.
