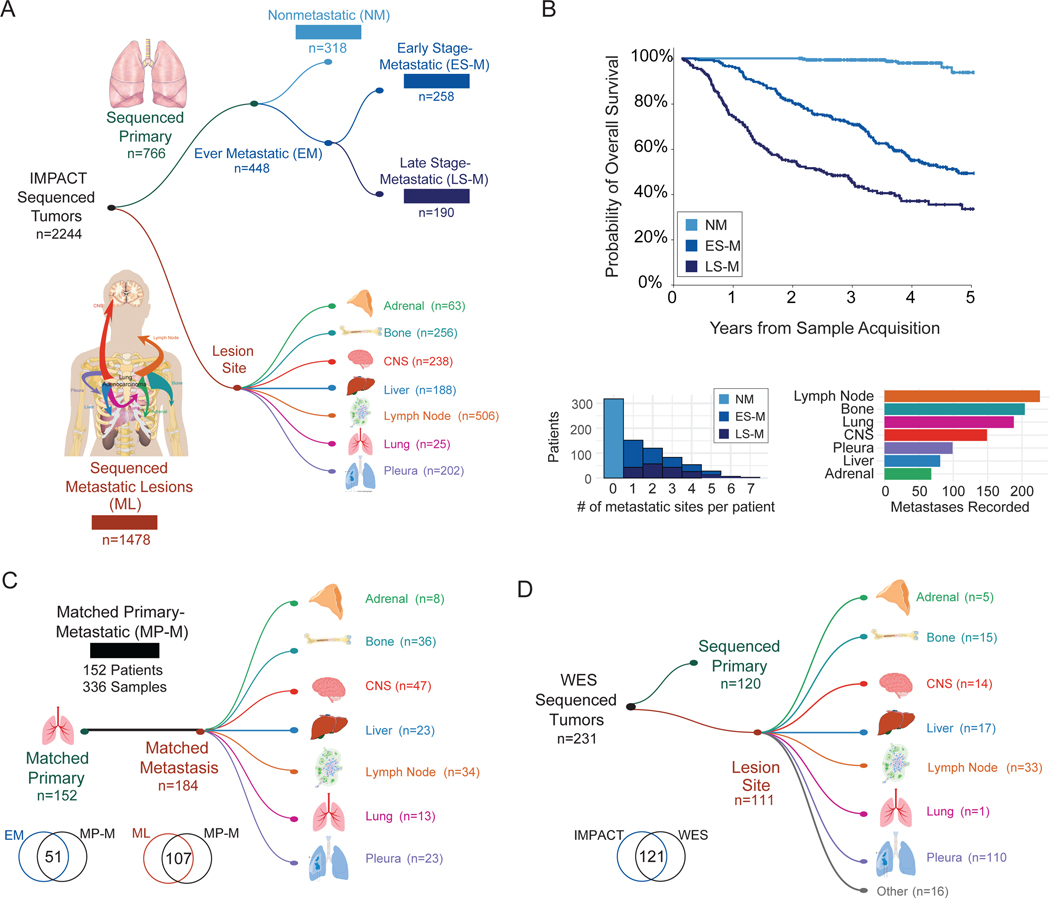
Figure 1. Cohort overview.
(A) Number of sequenced specimens in unmatched sample analyses, cohorts 1–4. (B) Clinical outcomes of patients with sequenced primary tumors, cohorts 1–3. Top: Kaplan-Meier curve showing overall survival. Bottom: Metastatic burden per patient (left). Number of patients with metastasis to specific anatomic sites (right). (C) Overview of patients with matched primary and metastatic samples, cohort 5. Overlap of samples included in cohorts 2–4 and matched cohort. (D) Primary and metastatic lesions with whole-exome sequencing (WES). Overlap of samples included in the IMPACT sequencing and WES cohorts. CNS, central nervous system.

