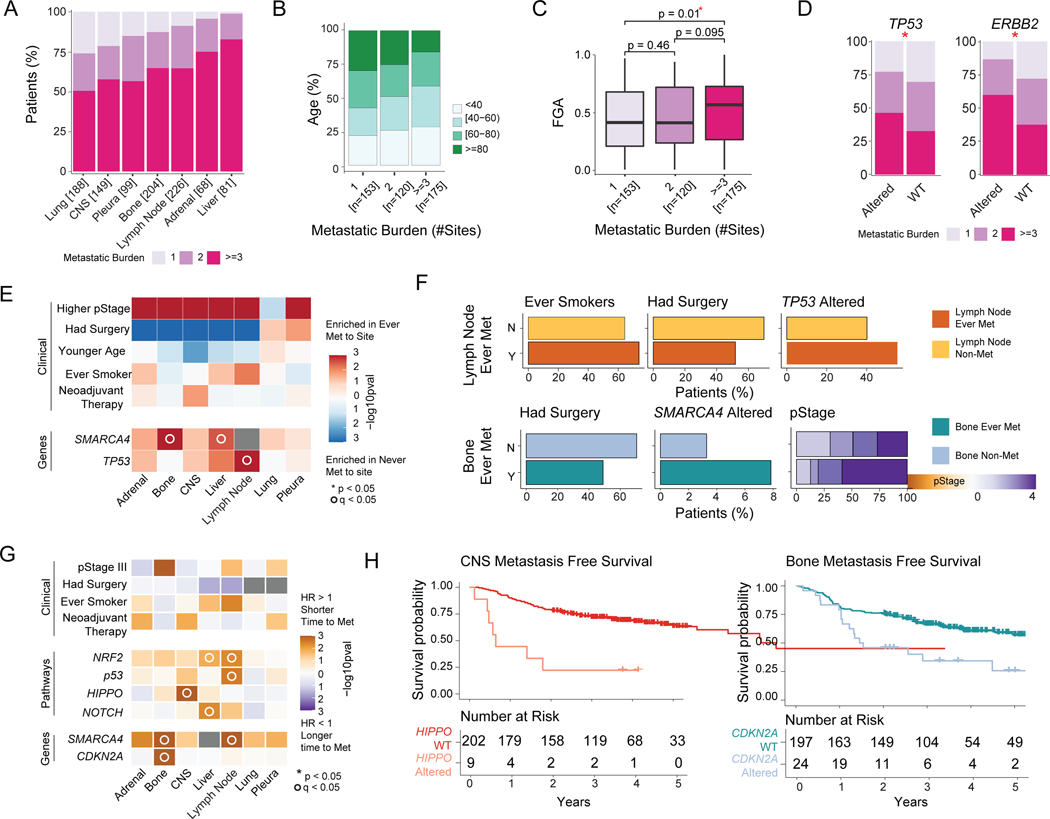
Figure 3. Clinicopathologic and genomic features of primary tumors associated with site-specific metastasis and metastatic burden.
(A) Metastatic burden stratified by anatomic site. Each bar represents all ever-metastatic patients with metastasis to a given site; colors correspond to proportion of patients with 1, 2, or ≥3 distinct metastatic sites. (B) Age of patients, stratified by metastatic burden. (C) Fraction of genome altered (FGA), stratified by metastatic burden. Boxplots display median values, interquartile range (IQR) boxes, and whiskers demonstrating 1.5 x IQR. (D) Metastatic burden for significantly different genes between altered and wild-type (WT) tumors. (E) Clinicopathologic and genomic features across each organ site. The fill color corresponds to features enriched in tumors ever metastatic to a given site or not metastatic to a given site. (F) Frequency of significant clinicopathologic features and genomic alterations in nonmetastatic and ever-metastatic tumors with metastasis to lymph node and bone on multivariable analysis. (G) Hazard ratio (HR) for clinicopathologic and genomic features in relation to time to metastasis across each organ site. HR >1 indicates shorter time to metastasis; HR <1 indicates longer time to metastasis. (H) Kaplan-Meier curves demonstrating site-specific metastasis-free survival (MFS) for Hippo pathway alterations for central nervous system (CNS) metastases and CDKN2A alterations for bone metastases. Statistical Analyses: (B) Pearson’s correlation. (C-D) Wilcoxon rank-sum test. *p<0.05. (E) Univariate logistic regression. *p<0.05 for clinicopathologic variables on univariable analysis; °q<0.05 for genomic features on univariable analysis. q-values correct for multiple comparisons using the false-discovery rate (FDR). (F) Multivariate logistic regression. Features shown are significant by p<0.05. (G) Cox proportional hazards model. p-values calculated from log-rank test. *p<0.05 for clinicopathologic variables on univariate analysis; °q<0.05 for genomic features on univariate analysis. Met, metastatic; N, no; pStage, pathologic stage; Y, yes.
See also Figures S3, S4, and Table S3.

