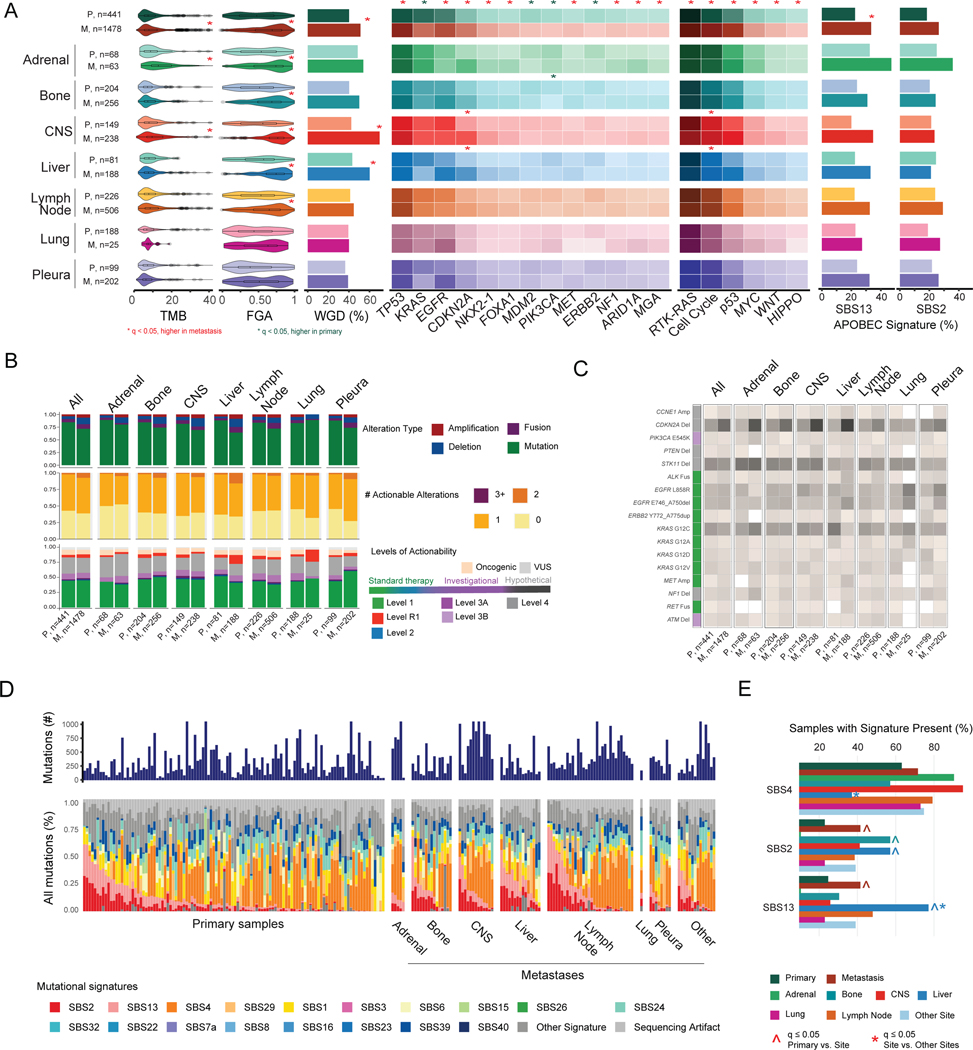
Figure 4. Genomic comparisons between primary tumors and metastases.
(A) Left to right: distributions of tumor mutational burden (TMB), fraction of genome altered (FGA), whole-genome duplication (WGD), gene alteration frequencies, pathway alteration frequencies, and frequency of samples presenting APOBEC signatures across groups. Boxplots display median values, interquartile range (IQR) boxes, and whiskers demonstrating 1.5 x IQR. Heat map lists alteration frequencies for genes and pathways as percentages. Darker colors correspond to higher percentage of altered samples. Statistical analysis: Wilcoxon rank-sum test for TMB and FGA; Fisher’s exact test for WGD, gene, pathway, and APOBEC signature frequencies. Significance indicated with a red or green * for q<0.05, false-discovery rate (FDR) adjusted. (B) Top to bottom: distributions of oncogenic alteration types, number of actionable alterations (levels 1 to 3A), and highest level of actionability across grouped sites. (C) Percentage of samples with actionable alterations. Color in the left column corresponds to level of actionability. (D) Mutational signature profiles of primary and metastatic lesions in WES cohort, with metastases stratified by anatomic site. (E) Frequency of samples with signature present for three mutational signatures of interest (SBS2, SBS4, SBS13). Statistical analysis: Fisher’s exact test. ^ and * indicate q<0.05, FDR adjusted, for comparisons of primary vs. lesion site and metastatic lesion site vs. all other metastatic lesions, respectively. CNS, central nervous system; M, metastasis; P, primary tumor; VUS, variant of unknown significance.
See also Figures S5–S7 and Tables S4–S6.

