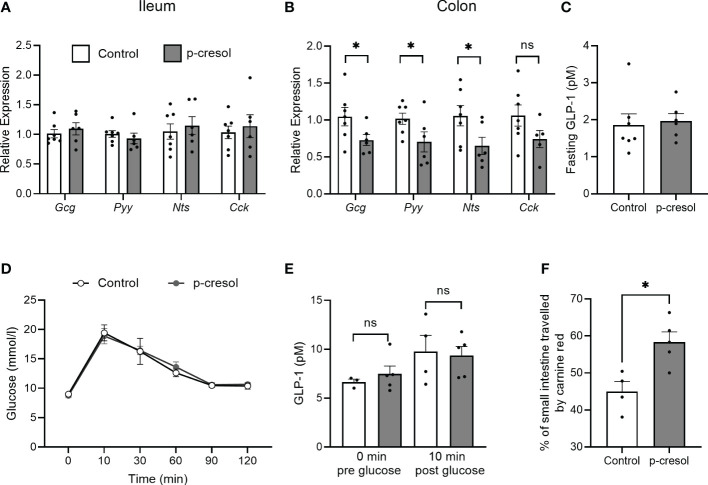
Figure 3.
RNA expression of proglucagon (Gcg), peptide YY (Pyy), neurotensin (Nts), and cholecystokinin (Cck) in (A) ileum (B) and proximal colon and (C) fasting plasma GLP-1 in control and p-cresol-supplemented mice (n = 6–7). (D) Oral glucose tolerance test, (E) GLP-1 pre- and post-glucose gavage, and (F) small intestinal transit (expressed as the percentage of the small intestine traveled by carmine red relative to total small intestinal length) in control and p-cresol-supplemented mice (n = 4–5). Data were analyzed using nonparametric Mann–Whitney U test, * p < 0.05. ns, not significant.

