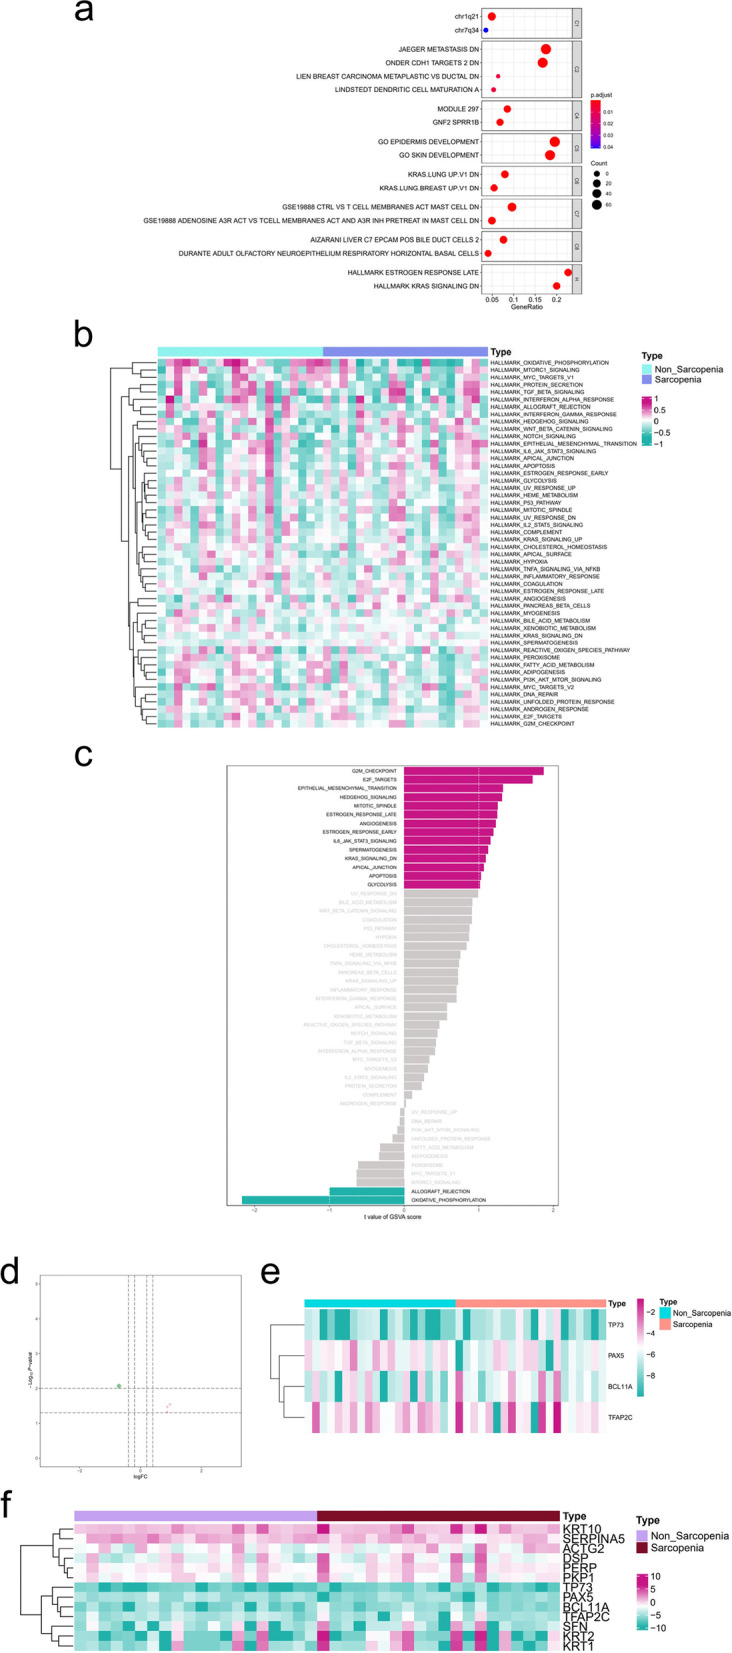
Fig. 3.

Identification of potential signaling pathways, DETFs and final DEGs in sarcopenia. a The ORA analysis of DEPs, and the bubble plot represents the top 2 or 4 differentially expressed genes sets for each collection. b The heatmap and (c) result of GSVA analysis of hallmark gene sets. The histogram showed 14 up-(red bar) and 2 down-regulated (green bar) differentially expressed sarcopenia-related pathways. d The volcano plot and (e) heatmap of 4 DETFs between 20 SP and 20 NSP. The expressional levels of TP73, BCL11A and TFAP2C were significantly increased in sarcopenia, while the PAX5 exhibited significantly decreased. f The heatmap of DETFs and final DEGs according to the result of PCA
