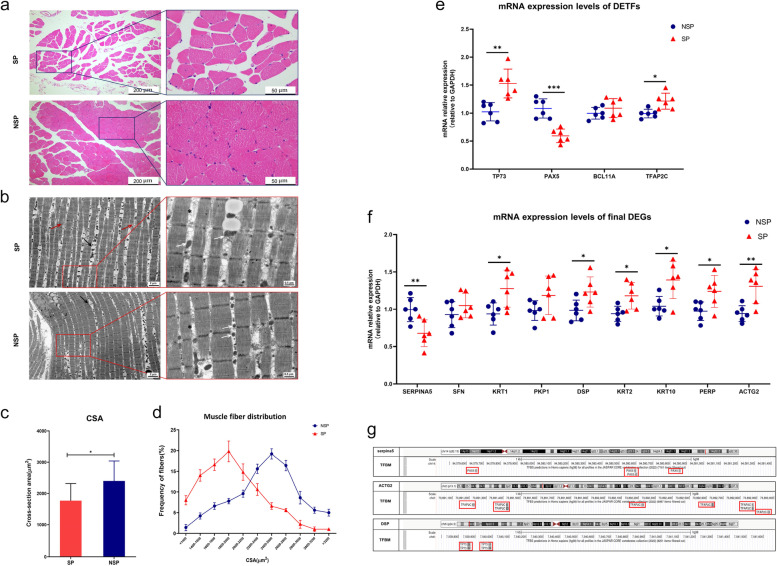
Fig. 6.
Identification of muscle morphology change in sarcopenia and validation of the regulatory mechanism between the DETFs and final DEGs. a Representative images of the tensor fascia femoris muscle fiber by H&E staining. Muscle fiber atrophy and the decrease of CSA was observed in SP c, d. (b) Representative images of TEM from the SP and NSP. In SP, myofibrils appeared atrophied and the interspace between myofibrils were enlarged (black asterisk). Myofilaments and sarcomeres became ruptured, fused, or disappeared (dark red arrows) and the number of lipid droplets (black arrows) between myofibrils significantly increased in SP. The percentage of abnormal mitochondria (white arrows) was also significantly increased in the SP. e The mRNA expressional levels of DETFs showed that TP73, TFAP2C were significantly upregulated in SP and the PAX5 was obviously downregulated in SP, while the BCL11A had no significant change between SP and NSP. f The expression of KRT10, ACTG2, DSP, PERP, KRT2, KRT1, BCL11A and TFAP2C, increased significantly, while the expression level of SERPINA5, which might be positive regulated by PAX5, decreased significantly. g The TFBM of PAX5, TFAP2C and TP73 were identified located in promoters of SERPINA5, ACTG2 and DSP respectively by using NCBI, UCSC and JASPAR database

