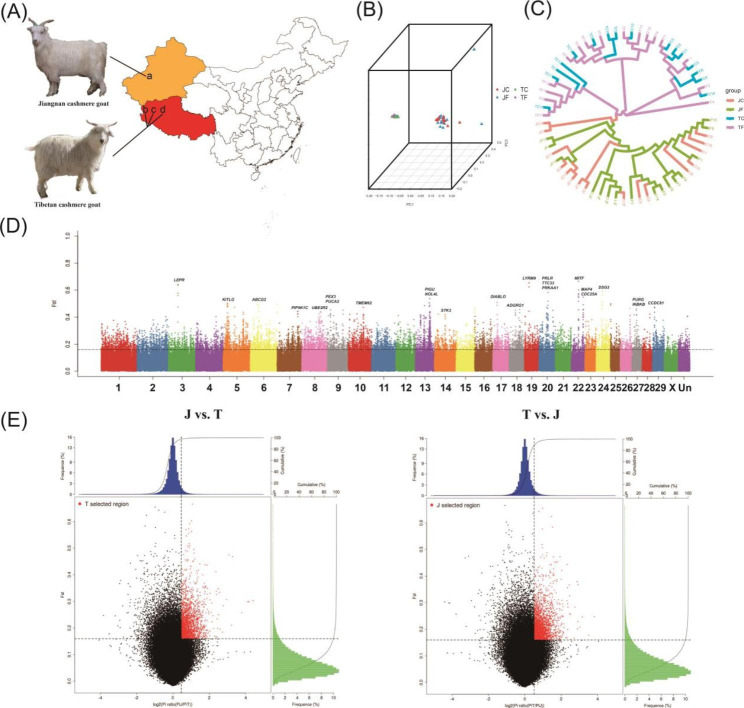
Fig. 1.
Sampling and genomic landscape of the divergence of Tibetan and Jiangnan cashmere goat breeds. (A) Map of cashmere goat sampling. The orange and red areas in the figure are the sampling areas of Jiangnan and Tibetan cashmere goat, respectively. In the map, a is Aksu Prefecture; b, c, and d are Ritu County, Gaize County, and Nima County, respectively. (B) Principal components of cashmere goat samples. (C) Phylogenetic tree of 64 cashmere goats. (D) FST in 5-kb sliding windows across autosomes between Tibetan and Jiangnan cashmere goats. (E) FST Pi selection elimination analysis. The X-axis of the scatter diagram is the log2(Pi (π) ratio) value and the Y-axis is the FST value, which correspond to the frequency distribution diagram above the scatter diagram and the frequency distribution diagram on the right, respectively. The area of red scatter points is the top 5% area selected by Pi (π) ratio and FST.

