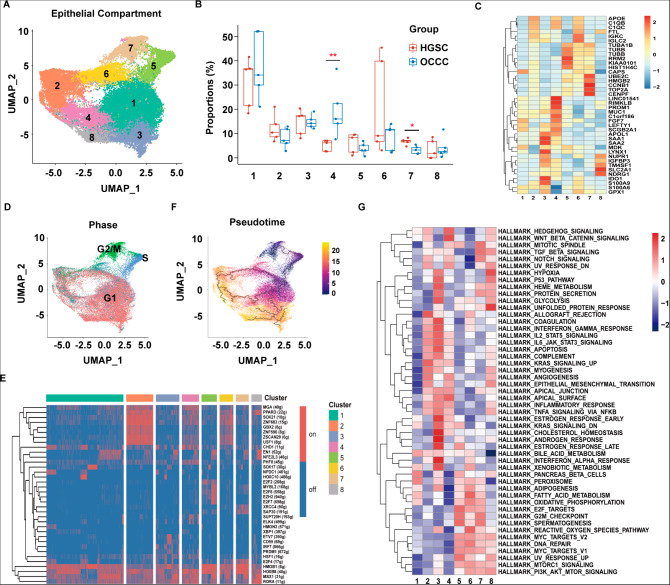
Fig. 1.
A higher proportion of LEFTY1 + epithelial subset cells and a lower proportion of epithelial subset cells in the G2/M phase were observed in OCCC samples than in HGSC samples. (A) UMAP plot displaying eight epithelial cell subpopulations. Each dot represents a single cell (n = 39,722). (B) The box plot shows the comparison of each epithelial cell percentage in the OCCC and HGSC groups. (C) Heatmap showing the average expression of the top 5 most highly expressed markers among epithelial cell subsets. (D) UMAP plot displaying the epithelial cell subsets in each cell cycle phase. (E) Heatmap showing regulon activity as analyzed by SCENIC. A “regulon” refers to the regulatory network of TFs and their target genes. “On” indicates active regulons; “Off” indicates inactive regulons. (F) Pseudotime reconstruction and development of epithelial cell subsets inferred from Monocle 3. (G) Pathway analysis of each epithelial cluster. P values were calculated by two-sided Wilcoxon test. *: p < 0.05, **: p < 0.01

