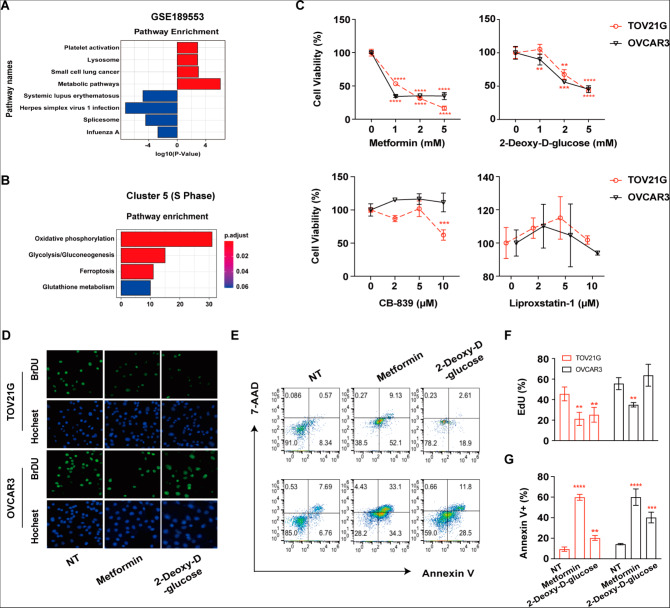
Fig. 3.
Glucose metabolism pathways are activated in OCCC cells and might be promising targets for both OCCC and HGSC treatments as indicated by in vitro experiments. (A) Bar plots showing the differentially expressed genes (DEGs) in the GSE189553 dataset with enriched Kyoto Encyclopedia of Genes and Genomes (KEGG) pathways. Red: OCCC; blue: HGSC. (B) Bar plots showing the differentially expressed gene (DEG)-enriched Kyoto Encyclopedia of Genes and Genomes (KEGG) pathways in Cluster 5 consisting of OCCC and HGSC patient cells. (C) TOV21G and OVCAR3 cells were treated with the indicated concentrations of CB-839, liproxstatin-1, metformin, and 2-deoxy-D-glucose, and cell viability was measured by CCK8 assay 72 h after treatment. (D) TOV21G/OVCAR3 cells were treated with metformin (5 mM) and 2-deoxy-D-glucose (5 mM) for 48 h. Representative images of EdU-positive cells by immunofluorescence. (E) TOV21G/OVCAR3 cells were treated with metformin (5 mM) and 2-deoxy-D-glucose (5 mM) for 72 h. Representative images of flow cytometry are presented. (F) Summary of the percentage of EdU-positive cells. (G) The percentage of Annexin V-positive cells was determined by flow cytometry. NT: no treatment. All assays were carried out in triplicate, and the data are presented as the mean ± S.D. * p < 0.05, ** p < 0.01, *** p < 0.001, **** p < 0.0001

