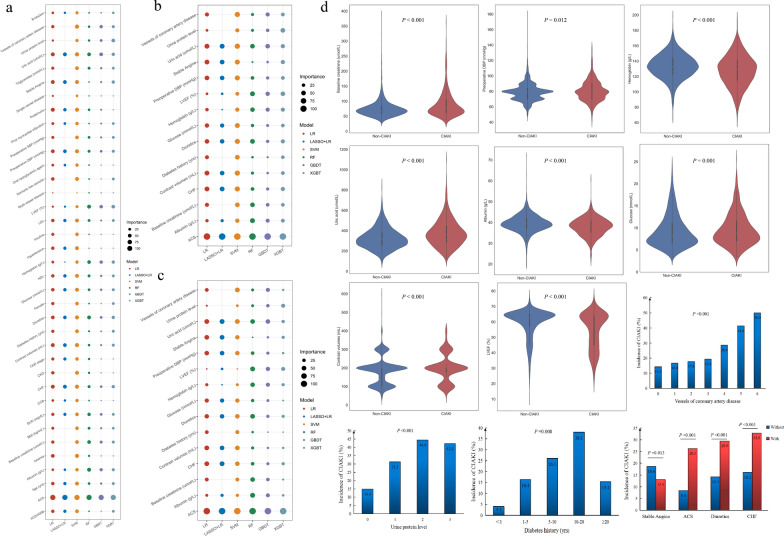
Fig. 2.
Importance of features in ML models and subgroup analysis of BCPMD features. a Importance rank of all features for identifying CIAKI in diabetes included in the 6 different ML models. The size of the circles represents the degree of contribution to CIAKI. The different colors of circles represent different models. b A subset of (a), showed the degree of contributions of 15 features in BCPMD for identifying CIAKI relative to all features of (a) in 6 different models. c Degree of contributions of 15 features in BCPMD for identifying CIAKI relative to each other in 6 different models. d Subgroup analysis of BCPMD features. Violin plots show the distribution of continuous features included in BCPMD between CIAKI patients (n = 634) and non-CIAKI patients (n = 2880). The thick black line in the middle represents the interquartile range [IQR]. The thin black line represents the 95% confidence interval. The white point is the median, and the shapes on both sides represent the distribution density of the data. The median [IQR] of the features shown in Fig. d are listed in Additional file 1: Table S5. Bar plots show the incidence of CIAKI among the categorical features of BCPMD. BCPMD, brief CIAKI prediction model for diabetes based on the XGBT model

