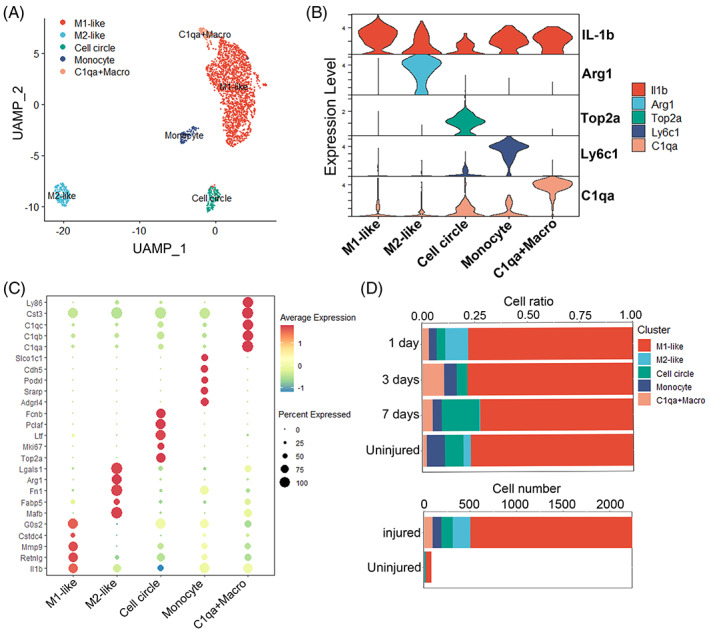
FIGURE 2.

Molecular profile of macrophages subtype heterogeneity acutely after SCI. (A) UMAP plots of macrophages subsets. (B) Violin plots showing the smoothed expression of marker genes in five macrophages subsets. (C) Dot plots showing the high expression of marker genes in five macrophages subsets. (D) The proportion and number of each cell type of macrophages in different groups.
