
Fig. 2.
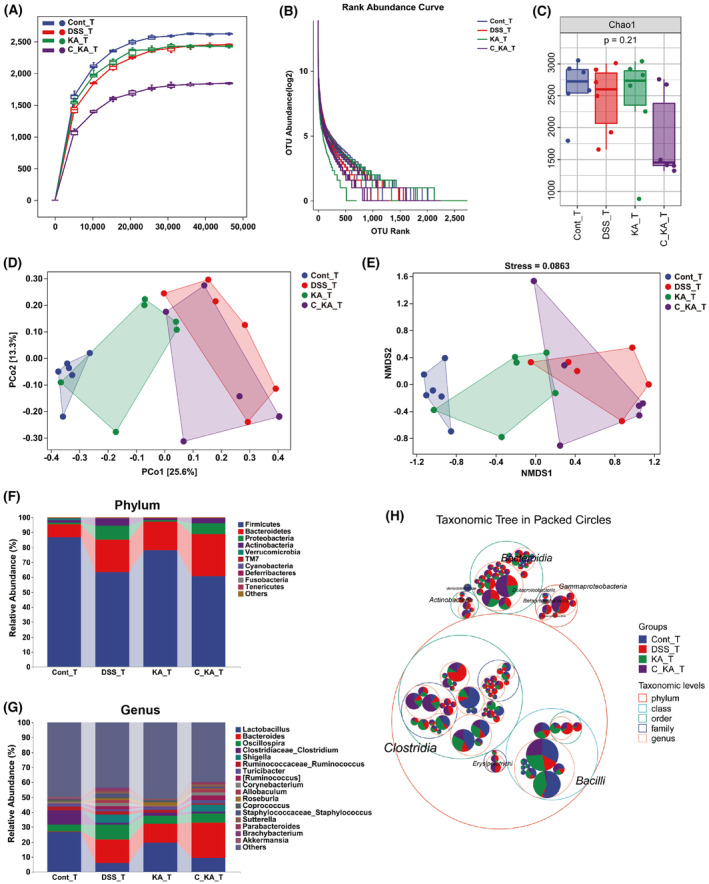
GPR35‐mediated KA sensing improves gut microbial composition in DSS‐induced colitis rats. (A, B) Rarefaction curve (A) and Rank abundance curve (B) of each group. (C) α‐diversity analysis of gut microbiota by Chao1 index. (D, E) The structural variation of the microbial communities across the samples was analyzed by PCoA (D) and NMDS (E). (F, G) The composition of gut microbiota at the phylum (F) and genus (G) levels among the different groups. (H) The distribution of the taxonomic units in the classification levels was analyzed by the taxonomic tree. The suffix of “T” in each group represents that the samples for analysis were obtained on day 10.