
Fig. 3.
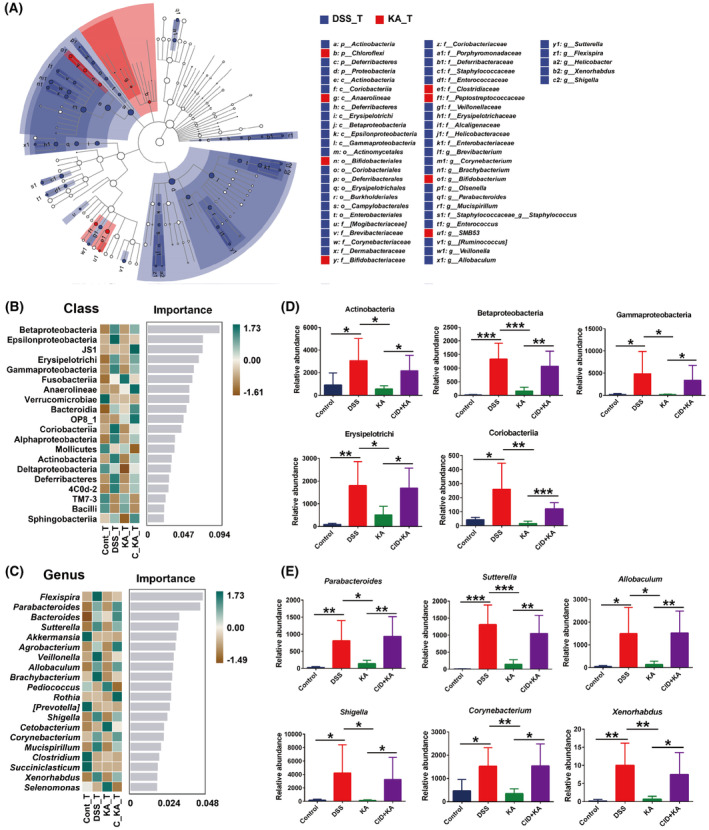
Identification of the differential species, which were associated with GPR35‐mediated KA sensing. (A) The LEfSe taxonomic cladogram indicated key bacterial alterations. The size of the circles was based on the relative abundance, the solid circle represented LDA >3.0, P < 0.05, and the hollow circle represented P > 0.05. (B, C) The importance of the gut microbiota on colitis characteristics at the class (B) and genus (C) levels was analyzed by Random Forest analysis and the top 20 taxa were displayed. (D, E) The relative abundance of the marked classes (D) and genera (E) that were closely associated with GPR35‐mediated KA sensing. The data are presented as mean ± SD. Statistical analysis was performed using the Student's t test. n = 6, *P < 0.05, **P < 0.01 and ***P < 0.001.