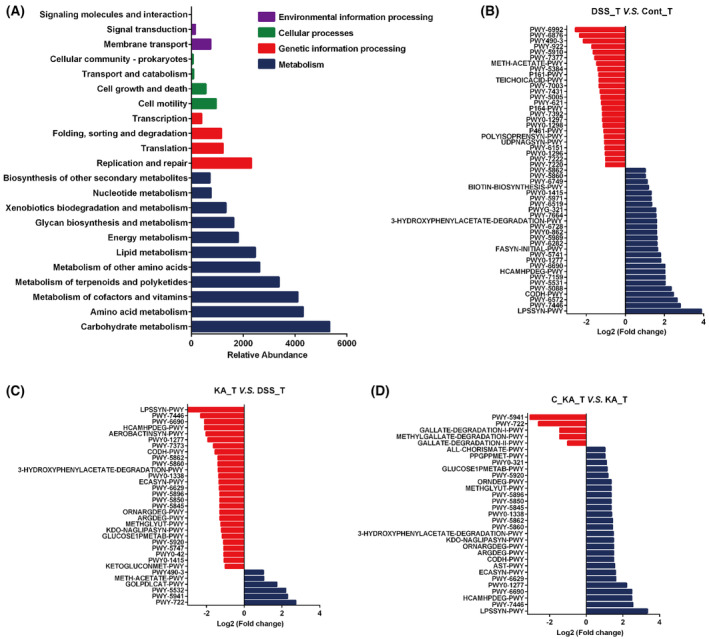
Fig. 7.

Functional and pathway enrichment analyses. (A) The functional annotation of the differential gut microbiome. (B–D) The pathway enrichment analyses were performed between the DSS_T and Cont_T groups (B), the KA_T and DSS_T groups (C), and the C_KA_T (CID2745687 + KA) and KA_T groups (D) based on the KEGG database (Fold change > 2).
