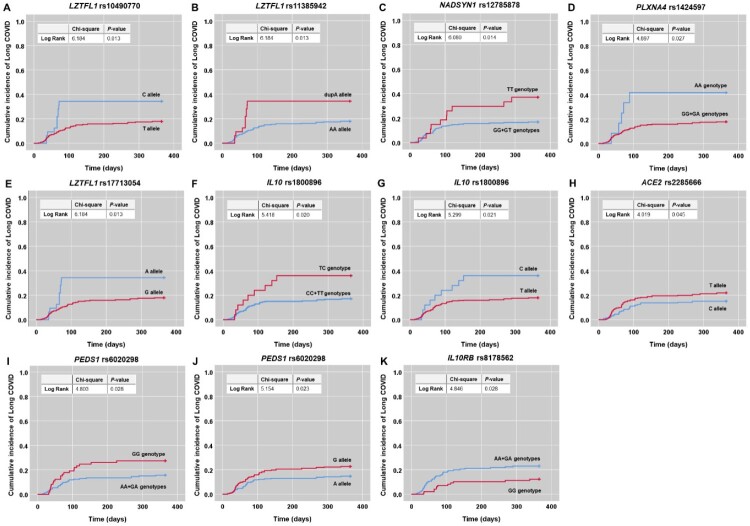
Figure 3.
Kaplan-Meier curves demonstrating associations between polymorphisms in nine significant genes and cumulative incidence of Long COVID. (A) LZTFL1 rs10490770 C allele. (B) LZTFL1 rs11385942 dupA allele. (C) NADSYN1 rs12785878 TT genotype. (D) PLXNA4 rs1424597 AA genotype. (E) LZTFL1 rs17713054 A allele. (F) IL10 rs1800896 TC genotype and (G) C allele. (H) ACE2 rs2285666 T allele. (I) PEDS1 rs6020298 GG genotype and (J) G allele. (K) IL10RB rs8178562 GG genotype.

