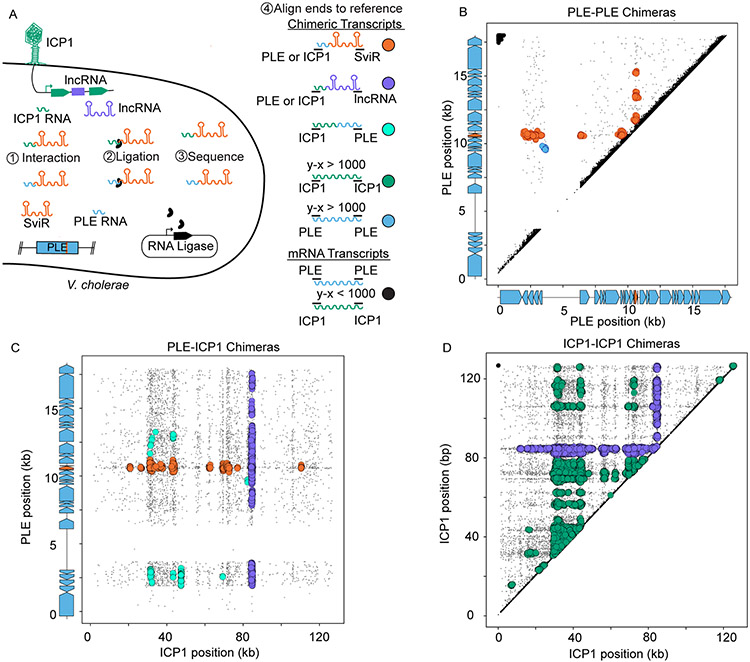
Figure 2). Hi-GRIL-seq during ICP1 infection detects a complex RNA-RNA interactome between PLE and ICP1 transcripts.
(A) A schematic of the Hi-GRIL-seq experiment carried out during ICP1 infection of PLE(+) V. cholerae. Assigning the genomic coordinates of the first and last 25 bp of each transcript provides an x-y coordinate pairing, which was then plotted for each read. Reads that map to the same genome with less than 1 kb between the ends of the transcript were treated as background reads (black), likely representing the ends of a single, non-chimeric transcript. Different classifications of transcript species, both chimeric (colors) and non-chimeric (black), are indicated to the right of the model.
(B, C, and D) The first and last 25 nt of Hi-GRIL-seq reads were mapped to the reference genomes of PLE-PLE transcripts (B), PLE-ICP1 transcripts (C), and ICP1-ICP1 transcripts (D). For the axes corresponding to PLE reads, the gene graphs on the graph axes demarcate protein-encoding ORFs in blue and sviR in orange. For PLE-PLE (B) and ICP1-ICP1 (D) interactions, upper triangle graphs were used to limit redundant mapping. Plotted reads were clustered using DBScan, where greater than 20 reads mapping to an area of diameter 250 bp (B), 350 bp (C), and 1000 bp (D), to scale for differences in genome size between PLE and ICP1, are indicated as a larger colored circle. Clusters of chimeras were colored according to the legend in (A). Reads not passing the threshold of clustering were colored gray and sized smaller than reads falling into a cluster. For the unclustered graphs and replicates, see Figure S3.

