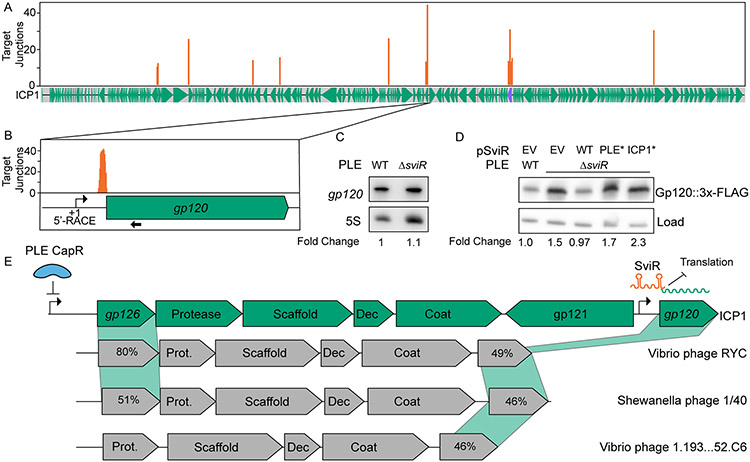
Figure 4). ICP1 Gp120 translation is decreased in the presence of SviR.
(A) Mapping of SviR-ICP1 chimeric junctions identified in Figure 3B to the ICP1 genome. The 25 bp following each SviR-ICP1 junction was mapped to the ICP1 reference genome. Mapping represents the average of three biological replicates and positions with an average number of reads less than 10 are not shown. The purple annotation on the ICP1 gene graph represents the ICP1 lncRNA. For individual replicates and unfiltered graphs, see Figure S6.
(B) Inset of SviR chimeras mapping to gp120, the target with the greatest average number of interactions of the SviR-ICP1 chimeras identified by Hi-GRIL-seq. The approximate position of the gp120 promoter is represented by a bent arrow icon, as determined by 5’ RACE and RNA-seq. The probe used for gp120 Northern blot in (C) is indicated by a black arrow under the gene graph.
(C) Northern blot analysis using a probe complementary to gp120. All RNA samples were isolated 16 minutes post-infection by ICP1, either in a PLE(+) or PLEΔsviR background. The values under each lane represent the gp120 transcript abundance, normalized to the 5S rRNA, compared to the wild type background between two biological replicates.
(D) Western blot analysis of Gp120::3x-FLAG ICP1 infection in a PLE(+) or PLEΔsviR background with the sviR expression construct as indicated (EV is the empty vector control, WT indicates expression of wild type SviR as in Figure 1D). SviRICP1* and SviRPLE* mutant alleles contain mutations highlighted in Figures 3D and 3E, respectively. Total protein input was normalized between lanes. The load control represents a non-specific FLAG background band present at approximately equal abundance across samples. The values under each lane represent the Gp120::3x-FLAG intensity, normalized to the loading control, compared to the wild type background, and averaged between three individual biological replicates. Each of the three biological replicates with the unaveraged normalized values as well as complementary statistical analyses, are shown in Figure S7.
(E) Gene graphs of ICP1 and non-related phages showing synteny of the capsid operon and a model of SviR-based regulation of gp120. CapR, PLE’s transcriptional repressor, binds upstream of gp126, downregulating the expression of ICP1’s capsid operon (Netter et al., 2021). gp121 encodes a putative mobile homing endonuclease gene, hypothesized to de-couple the regulation of gp120 from the rest of the capsid operon. Functional annotations of gene products from related phages are based on Pfam domain predictions using the HHPRED webserver. For gene products without annotation, percent amino acid similarity to ICP1 Gp126 or Gp120 was shown instead. Dec = capsid decoration protein; Prot. = scaffold protease, Coat = major capsid protein, Scaffold = predicted capsid maturation protease.

