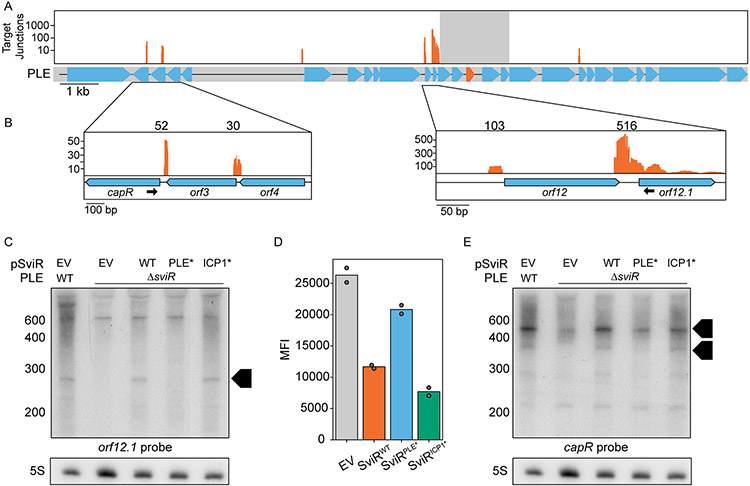
Figure 5). SviR regulation leads to altered levels of transcripts across PLE.
(A) Mapping of the SviR-PLE chimeras to the PLE reference genome. The mapping was performed as described in Figure 4A. The reads mapped here represent the average of three biological replicates. Positions with fewer than 10 interactions are filtered out to decrease noise. For each individual replicate and the unfiltered graphs, see Figure S6. Reads are mapped on a log scale in (A) due to the range of values mapped. The gray box overlaying the SviR annotation (orange) on the PLE gene graph represents the 1kb region flanking the center of SviR, where chimeric reads were unable to be discerned from non-chimeric transcripts due to proximity to the sRNA.
(B) Inset images of PLE target junction mapping. Zoomed insets show a linear scale of SviR interactions with capR (left) and orfs12 and 12.1 (right). The black arrows indicate the Northern blot probes used in (C) and (E). Scales in each inset differ based on local maxima.
(C and E) Northern blot analysis using a probe complementary to orf12.1 (C) or capR (E) in the 5’ region of the ORF as indicated in (B). All RNA samples were isolated 16 minutes post-ICP1 infection. SviRPLE* and SviRICP1* mutant alleles contain mutations highlighted in Figures 3E and 3D, respectively. Black boxed arrows highlight transcript species differentially regulated by SviR in a manner dependent on the PLE seed region. Blots were stripped and re-probed with each target probe, resulting in identical 5S images for both orf12.1 and capR blots.
(D) Flow cytometry analysis of orf12.1::GFP expression in the presence and absence of SviR alleles in E.coli. sviR expression was induced in all samples and mean population fluorescence was measured. Graphed values represent the mean fluorescent intensity of the GFP(+) population of 50,000 counted events, analyzed with FlowJo.

