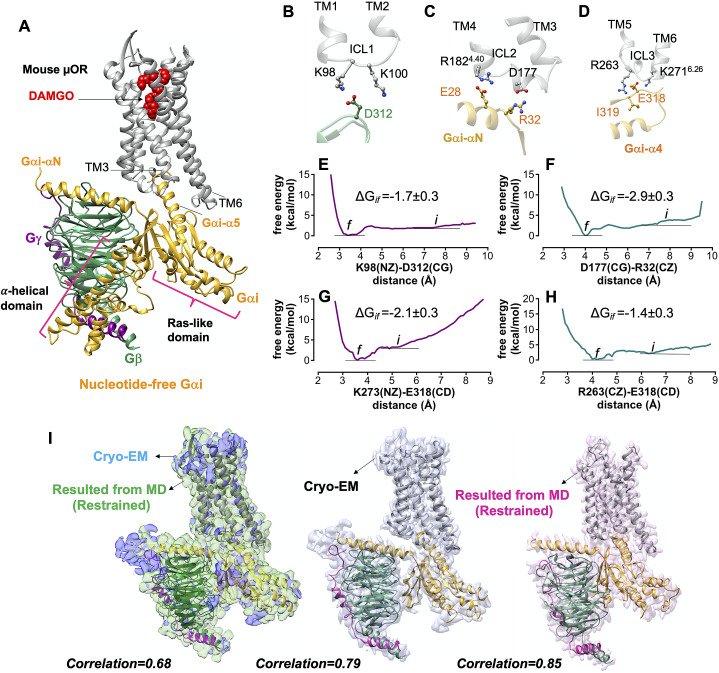
Fig. 2.
Gi protein binds the mouse μOR by forming ionic anchors to each of three ICLs. (A) The energy minimised mouse μORGi complex derived from ~450 ns MD and ~1.8 μs metaMD simulations. After ~450 ns MD simulation the RMSD = 1.3 Å from the original Cryo-EM structure. (B) The salt bridge anchor from the Gβ subunit to the ICL1. (C) Salt bridge anchors from the Gαi subunit to ICL2 and cytoplasmic end of TM4. (D) Salt bridge and hydrogen bond anchors from the Gαi subunit to the ICL3 and to the cytoplasmic end of TM6. Binding free energy between ionic anchors from metaMD. (E) K98(NZ)-D312(CG) salt bridge coupling Gβ to ICL1, (F) D177(CG)-R32(CZ) salt bridge coupling Gα to ICL2, (G) K273(NZ)-E318(CD) and (H) R263(CZ)-E318(CD) salt bridges coupling Gα to ICL3 and TM6.) Comparison of the optimised complexes from MD simulations with the Cryo-EM structure. Alignment of the density-map obtained by MD simulation with the backbone atoms restrained to the Cryo-EM density map (left). Here, the explicit structure is the snapshot at ~450 ns of MD simulation. (Middle): Alignment of the Cryo-EM structure (PDB ID: 6ddf) to the Cryo-EM density map. (Right): Alignment of the Cryo-EM structure (PDB ID: 6ddf) to the density map obtained from MD simulation with the backbone atoms restrained. Interestingly, our optimised density map has a better correlation with the Cryo-EM structure (PDB ID: 6ddf). Thus, our refined mouse structure can be considered as an experimental structure enhanced to achieve the atomic resolution of the full Gi-μOR-agonist complex. The weighted averages and the standard deviations were calculated for the converged period between the initial configuration before metaMD ‘i’ and the final conformation ‘f’ after metaMD calculations (Supplementary Fig. S1).

