Fig. 7.
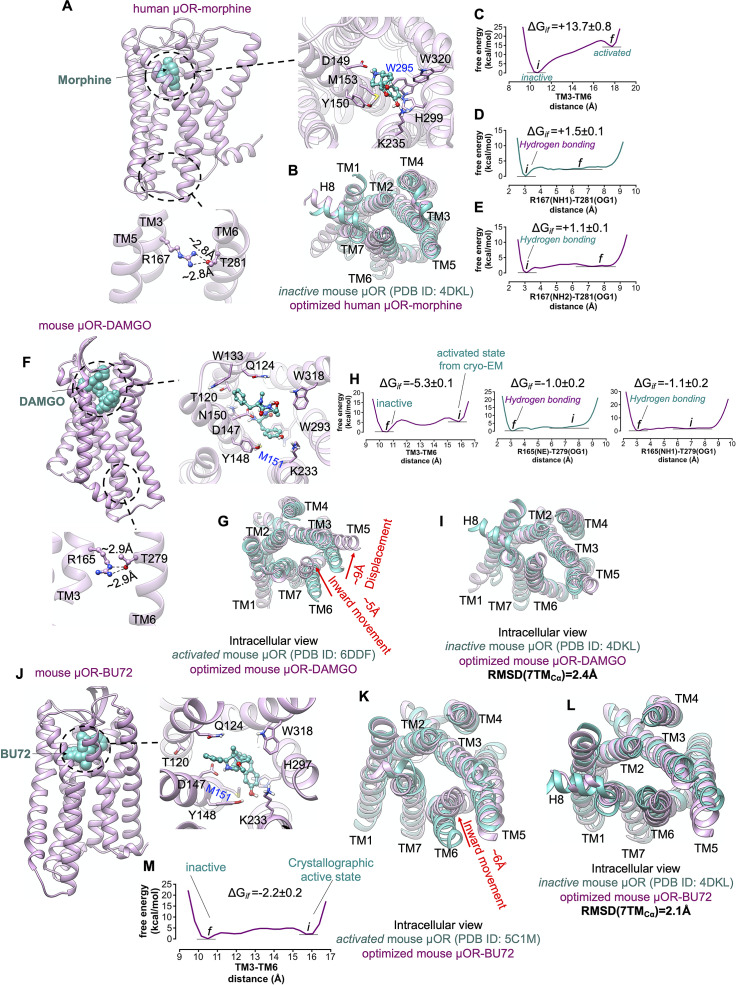
μOR possesses a weak allosteric coupling. (A,F,J) Our minimised structures of human μOR-morphine, mouse μOR-DAMGO and mouse μOR-BU72, respectively, in the absence of Gi protein or a mimetic Gi protein nanobody. Agonists alone cannot open up the cytoplasmic region of μOR, especially the hydrogen bond between R3.50 and T6.34. (B) Comparison of the minimised human μOR-bound morphine (pink) with the crystallographic inactive conformation of mouse μOR (green) resolved by crystallography (Manglik et al., 2012). MetaMD free energy of (C) the distance between TM3 (the centre of mass of Cα for residues 161–172) and TM6 (the centre of mass of Cα for residues 274–285). (D) The interaction between R1673.50(NH1)-T2816.34(OG1). (E) The interaction between R1673.50 (NH2)-T2816.34(OG1). (G) Comparison of the minimised mouse μOR-bound DAMGO (pink) with the crystallographic active state conformation of mouse μOR (green) resolved by Cryo-EM (Koehl et al., 2018), which indicates that removing Gi protein from the fully active state leads to remarkable contraction in the cytoplasmic region of μOR. MetaMD free energy of (H) Left: the distance between TM3 (the centre of mass of Cα for residues 159–170) and TM6 (the centre of mass of Cα for residues 272–283), middle: the interaction between R1673.50 (NE)-T2816.34(OG1), right: the interaction between R1673.50 (NH1)-T2816.34(OG1). (I) Comparison of the minimised mouse μOR-bound DAMGO (pink) with the crystallographic inactive conformation of mouse μOR (green). Comparison of the minimised mouse μOR-bound BU72 (pink) with: (K) The crystallographic active state (Huang et al., 2015) of mouse μOR (green). (L) The crystallographic inactive state of mouse μOR (green). BU72 alone (a nanobody removed from the complex) cannot maintain the active state conformation. (M) MetaMD free energy of the distance between TM3 (the centre of mass of Cα for residues 159–170) and TM6 (the centre of mass of Cα for residues 272–283). All RMSDs were calculated for the Cα atoms on the TM domains. The weighted averages and the SD were calculated for the converged period between the initial configuration before metaMD ‘i’ and the final conformation ‘f’ after metaMD calculations (Supplementary Fig. S9).

