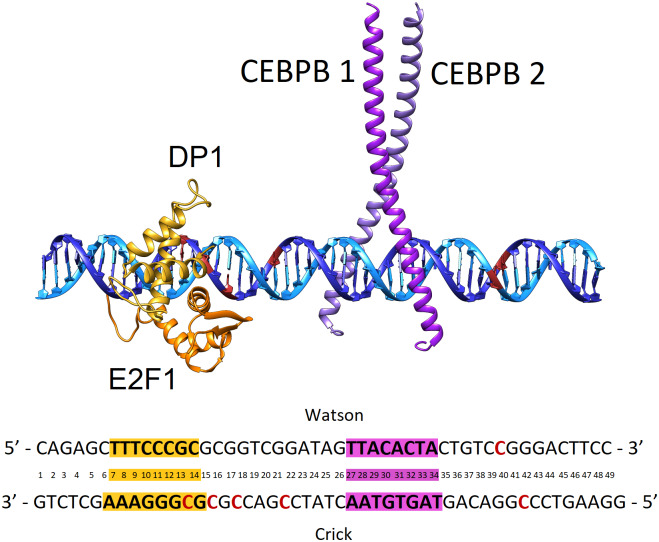
Fig. 1.
Model system structure of the E2F1-DP1–CEBPB–DNA enhanceosome complex. DNA Watson strand (5′→3′ direction) in light blue, DNA Crick strand (3′→5′ direction) in dark blue, with cytosine residues where methylation occurs in red, E2F1 monomer in orange, DP1 monomer in yellow, CEBPB monomer 1 in magenta and CEBPB monomer 2 in purple. Below is the DNA b.p. numbering used in the model with cytosine methylation sites in red and response elements in yellow and magenta for E2F1-DP1 and CEBPB dimers, respectively.

