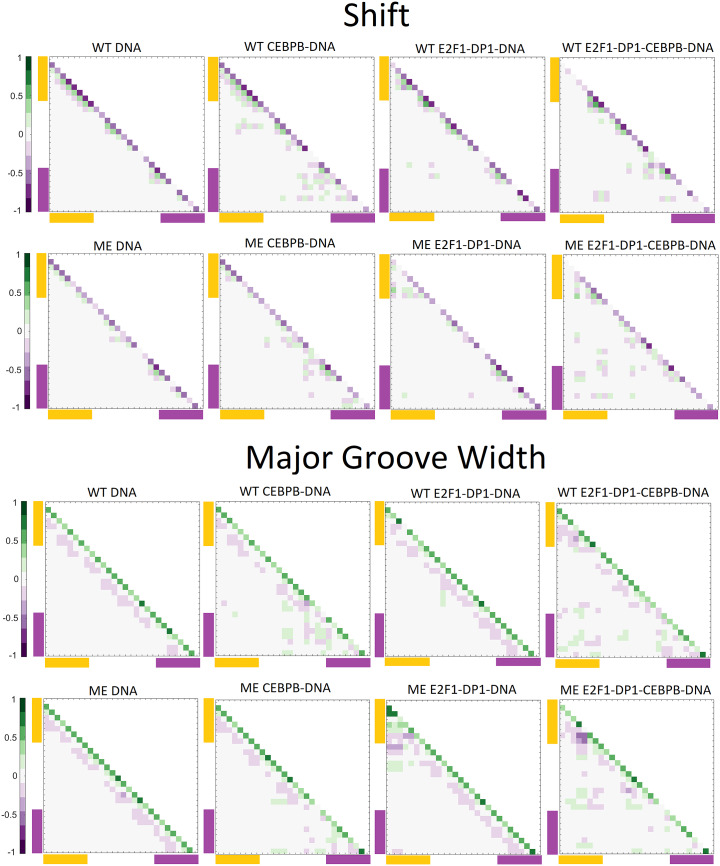
Fig. 6.
Correlation coefficient maps without time lag for b.p. shift and major groove width along the WT and ME sequences for DNA alone and in complex with either CEBPB/E2F1-DP1 dimers, or with both TFs dimers CEBPB–E2F1-DP1. Correlation coefficients are calculated for the entire (0.1–1.1 μs) trajectories. In all panels, the E2F1-DP1 response element is marked with yellow and the CEBPB response element is marked with magenta.

