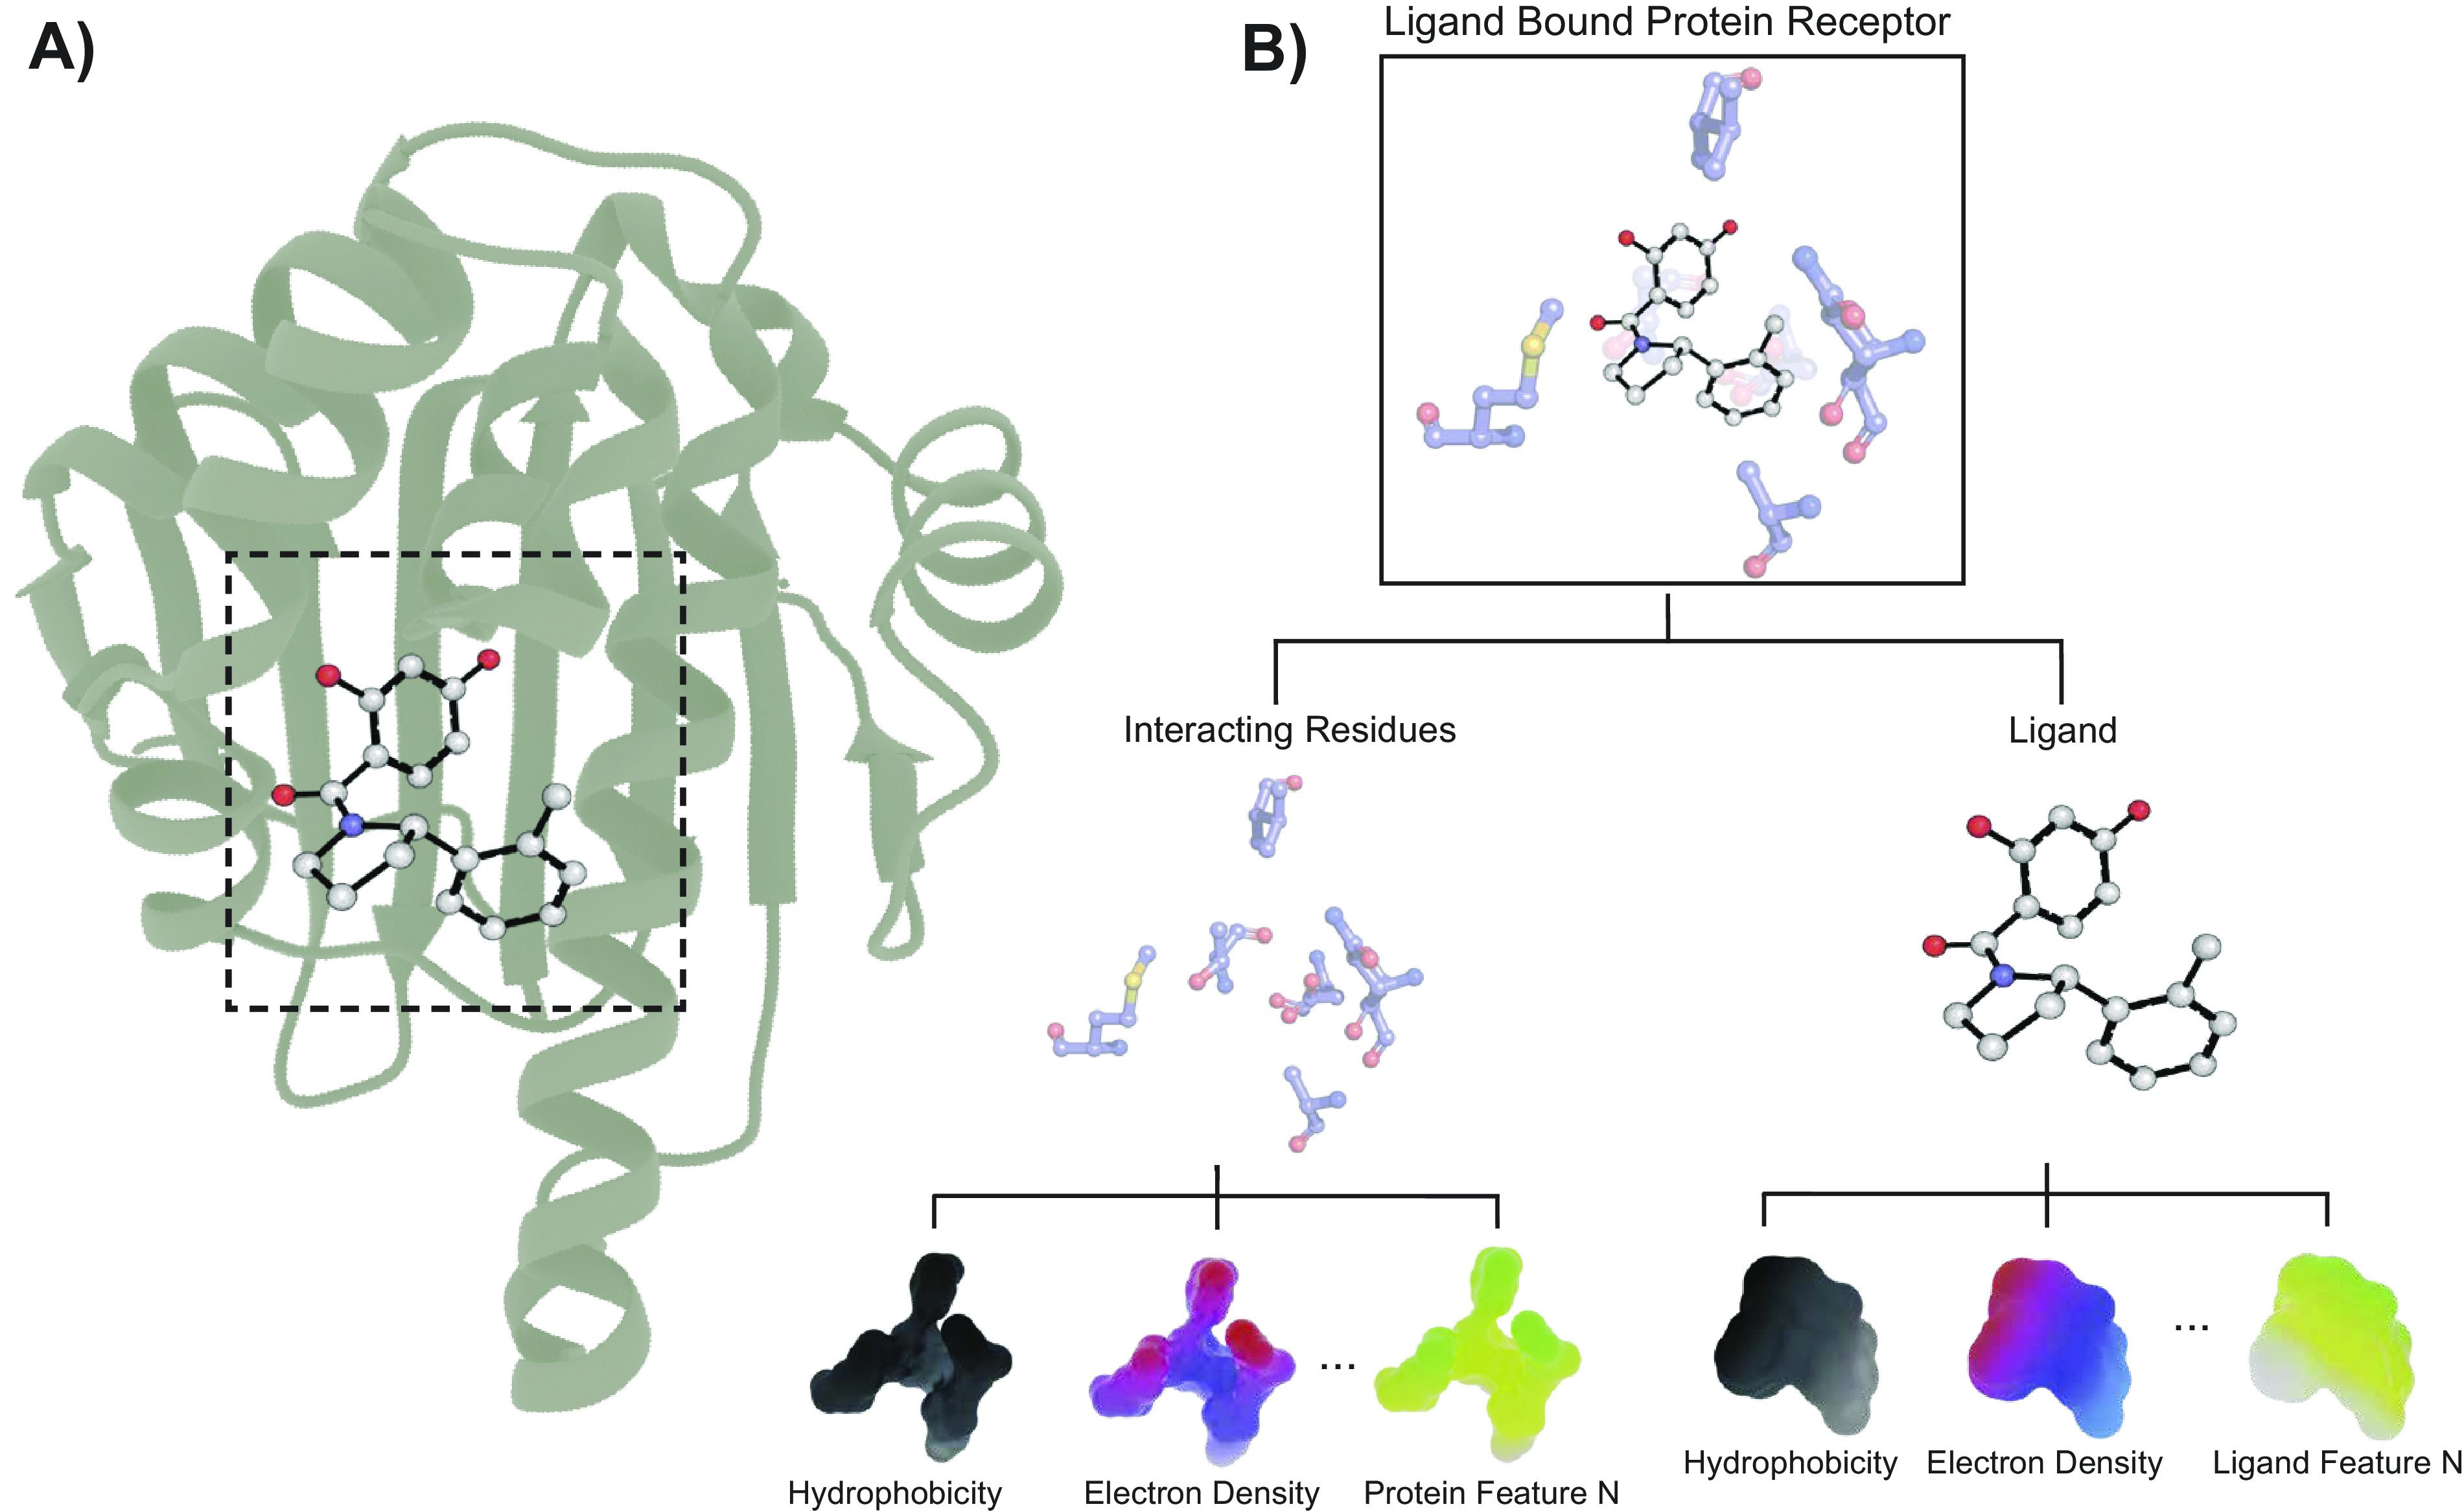
Fig. 3.

Illustration of computational binding affinity prediction. (a) Small molecule is docked into a target protein. (b) The binding site and the small molecule are then characterised with many features in order to predict the binding affinity. The atoms in the small molecule are shown in grey, blue and red for carbon, nitrogen and oxygen, respectively. The carbon, nitrogen, oxygen and sulphur of the binding site residues are shown in blue, purple, red and yellow, respectively. Bonds in the small molecule ligand are shown in black.
