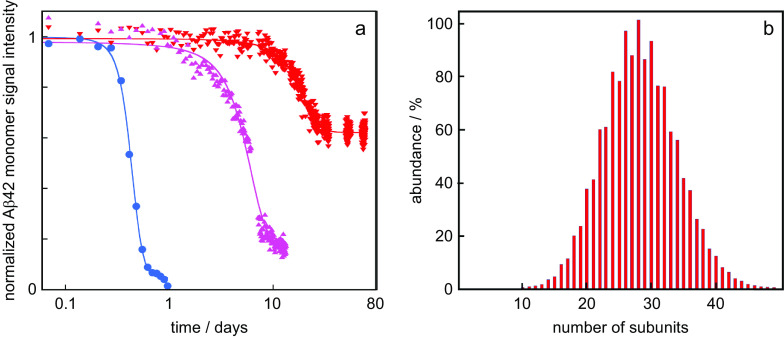
Fig. 2.
Data from the literature. (a) Normalised Aβ42 monomer signal as a function of time as measured using solution nuclear magnetic resonance (NMR) spectroscopy for samples composed at time zero of 20 μM Aβ42 (blue circles), 20 μM Aβ42 + 2 μM DNAJB6 (red downward triangles) or 20 μM Aβ42 + 2 μM DNAJB6 mutant (purple upward triangles) in which 18 serine and threonine residues have been changed to alanines. These data are from (Månsson et al., 2018) plotted with logarithmic x-axis. (b) Oligomer size distribution of the HSP70 chaperone as measured using mass spectrometry, replotted from data in Baldwin et al. (2011a).

