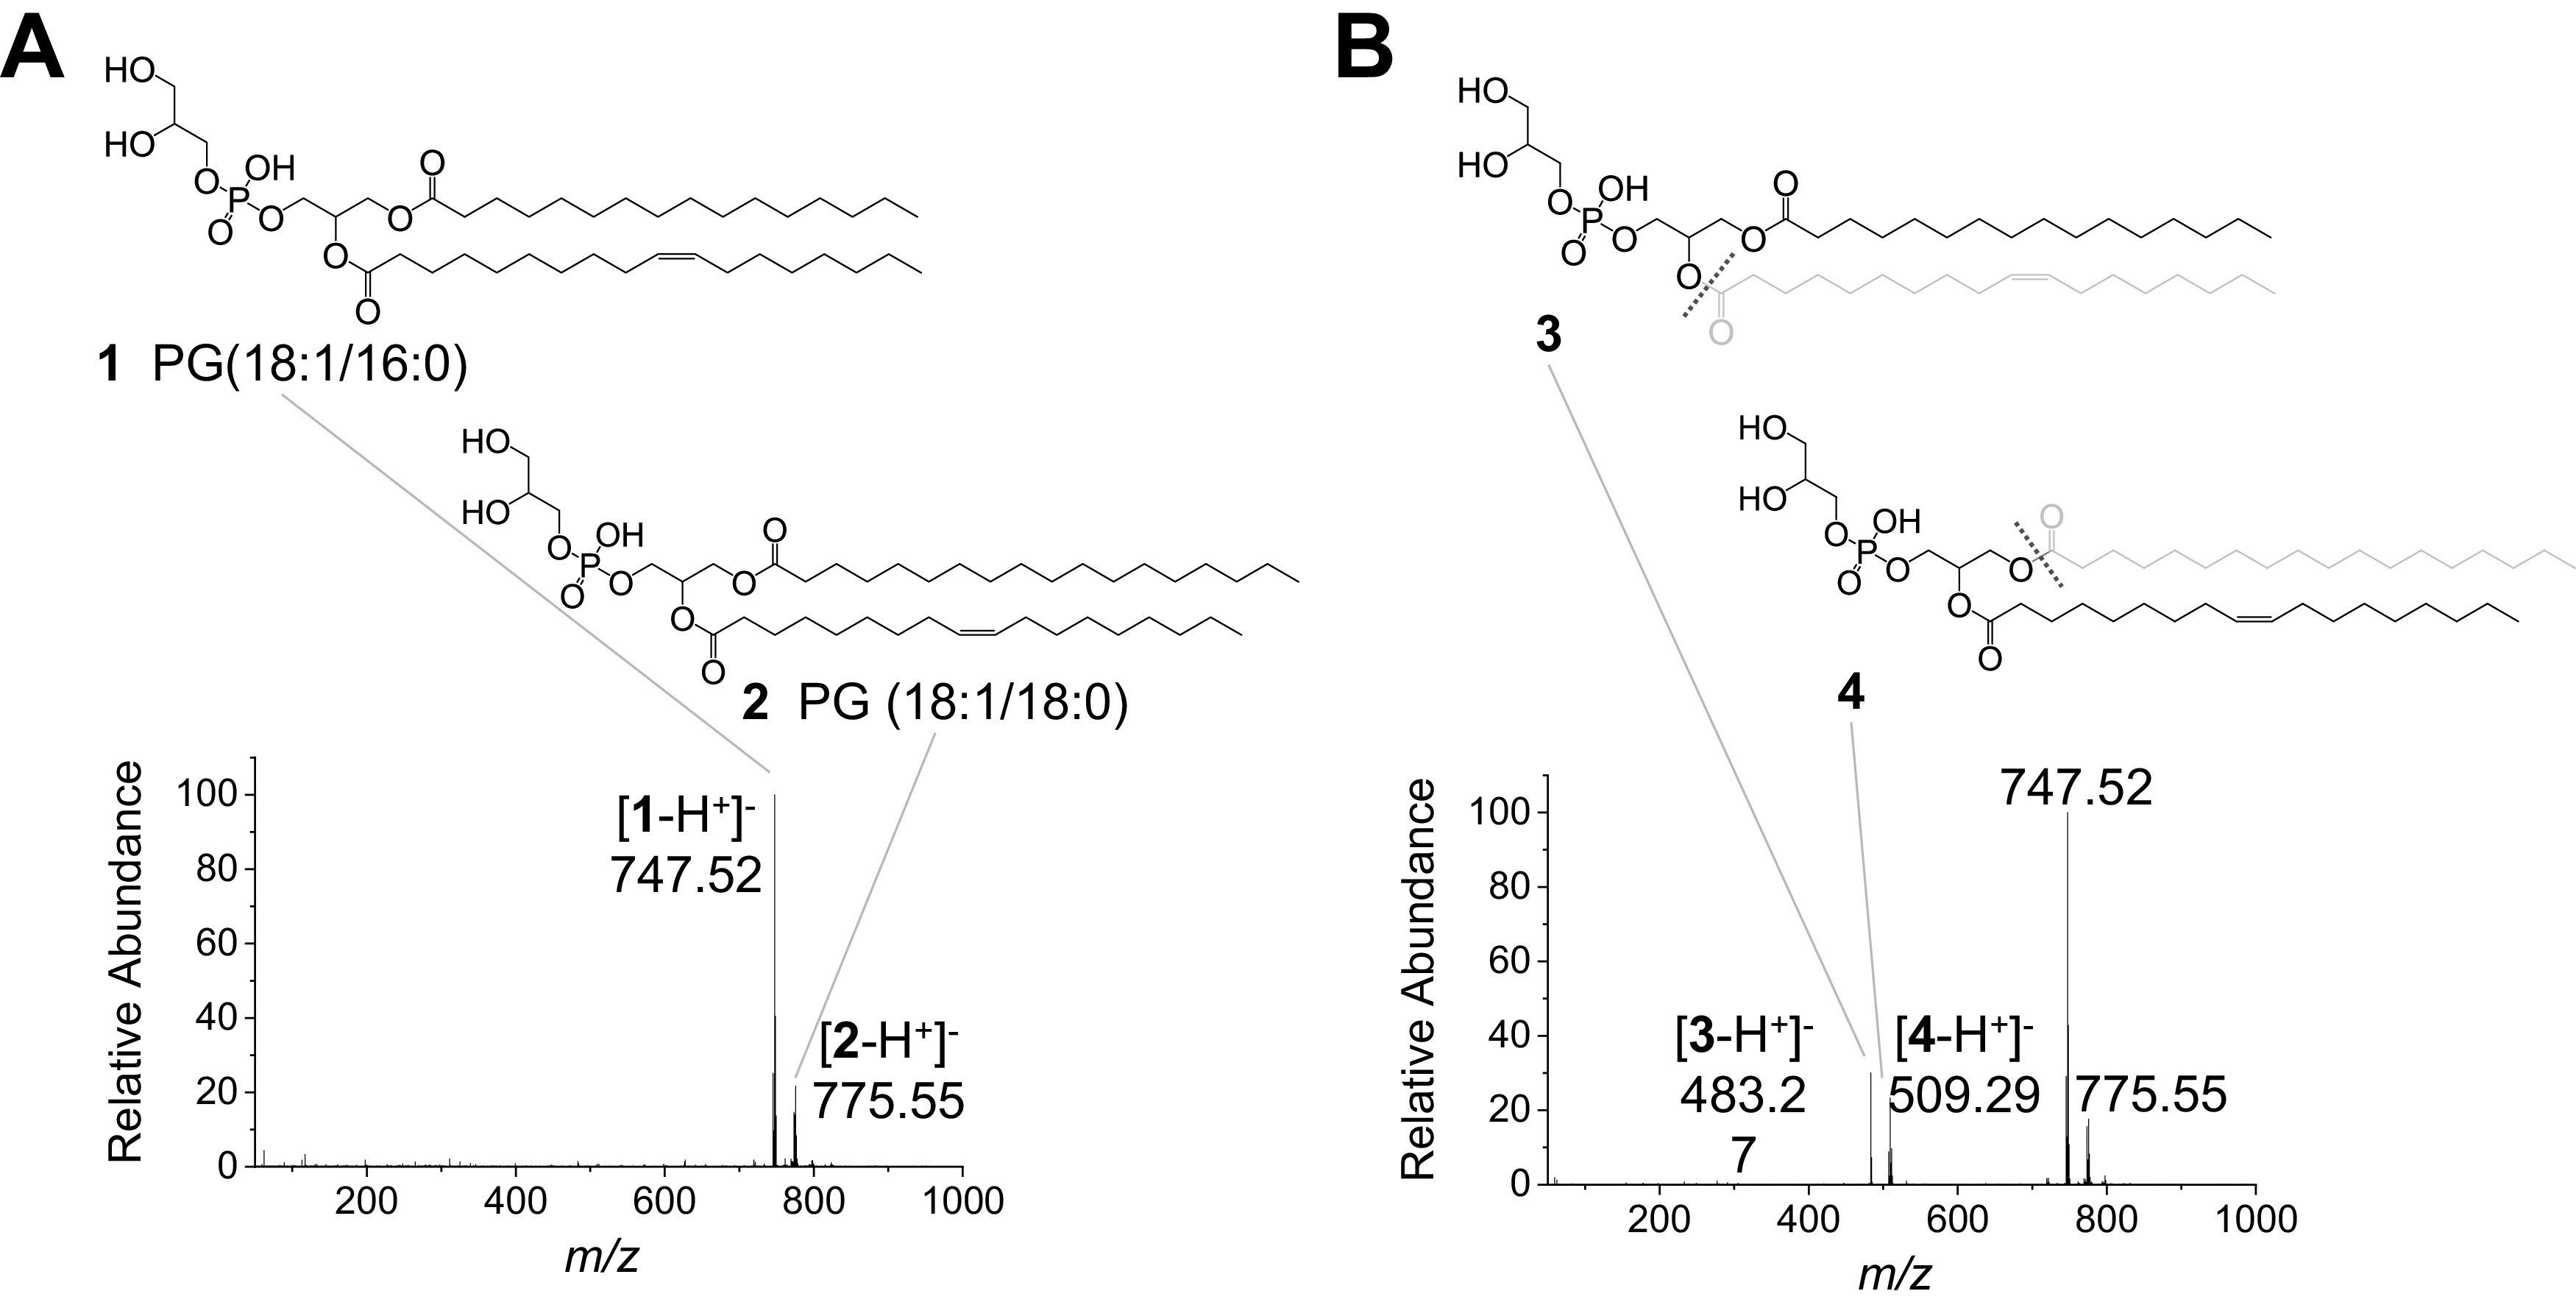
Fig. 5.

Comparison of mass spectra of PGs 1 and 2, which are present in E. coli, with intact PGs versus AquaROS-treated PGs. (a) Mass spectrum of standard sample (no AquaROS treatment). (b) Mass spectrum of AquaROS-treated PGs showing both fragmented structures 3 and 4 for PG 1 and PG 2, respectively, and intact PG 1 and 2.
