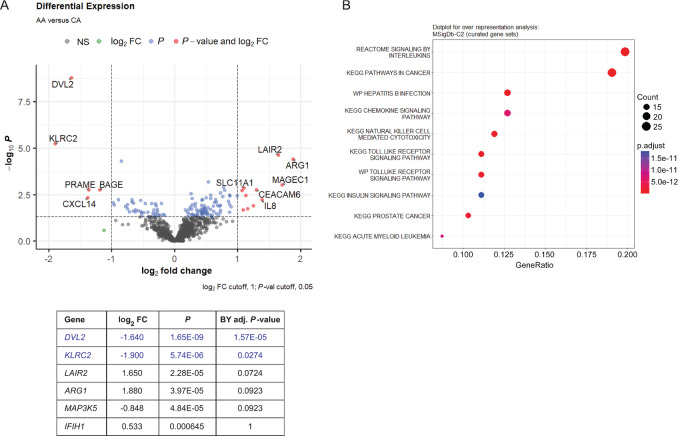
FIGURE 1.
Differentially expressed immune-related genes in AA and CA tumors and pathway overrepresentation analysis. A, Volcano plot showing cutoffs for top differentially expressed genes in 26 AA tumors compared with 25 CA tumors as baseline. Red symbol genes in plot represent differentially expressed genes, with unadjusted P values < 0.05 and log2FC values either above 1 or below −1. FDR correction was applied, and only genes at or below Benjamini–Yekutieli adjusted P value of 1 are listed. Genes listed in blue text are significant following FDR correction at adjusted P value < 0.05. B, Dot plot highlighting top 10 relevant pathways detected by over representation analysis of 120 genes with differential expression P value < 0.05 using the MSigDb-C2 database.

