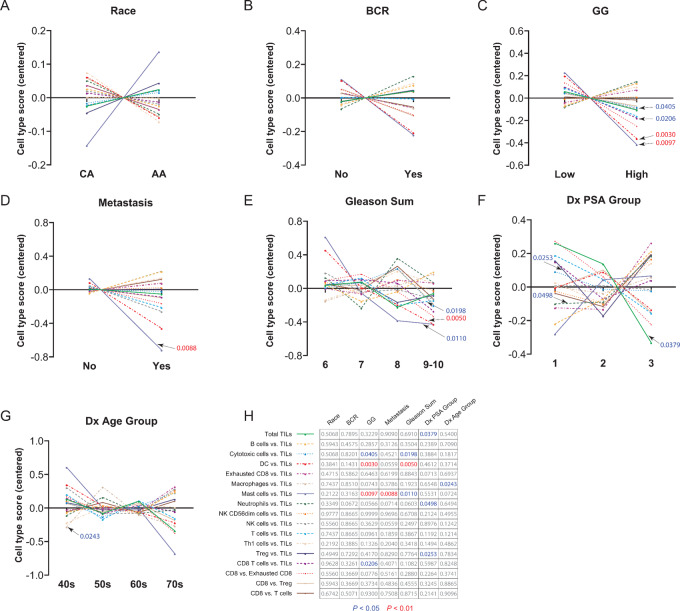
FIGURE 3.
Immune cell profiling of prostate tumors based on clinicopathologic variables. Centered cell type scores are shown for race (A), BCR (B), GG (C), metastasis (D), Gleason sum (E), PSA at diagnosis (Dx PSA) group (F), and age (G) at diagnosis (Dx Age) group. H, Grid outlining cell type ratios for each clinicopathologic variable, based on Mann–Whitney U test (A–D) or Kruskal–Wallis test (E–G) at P values < 0.05 (blue), < 0.01 (red), and > 0.05 (gray).

