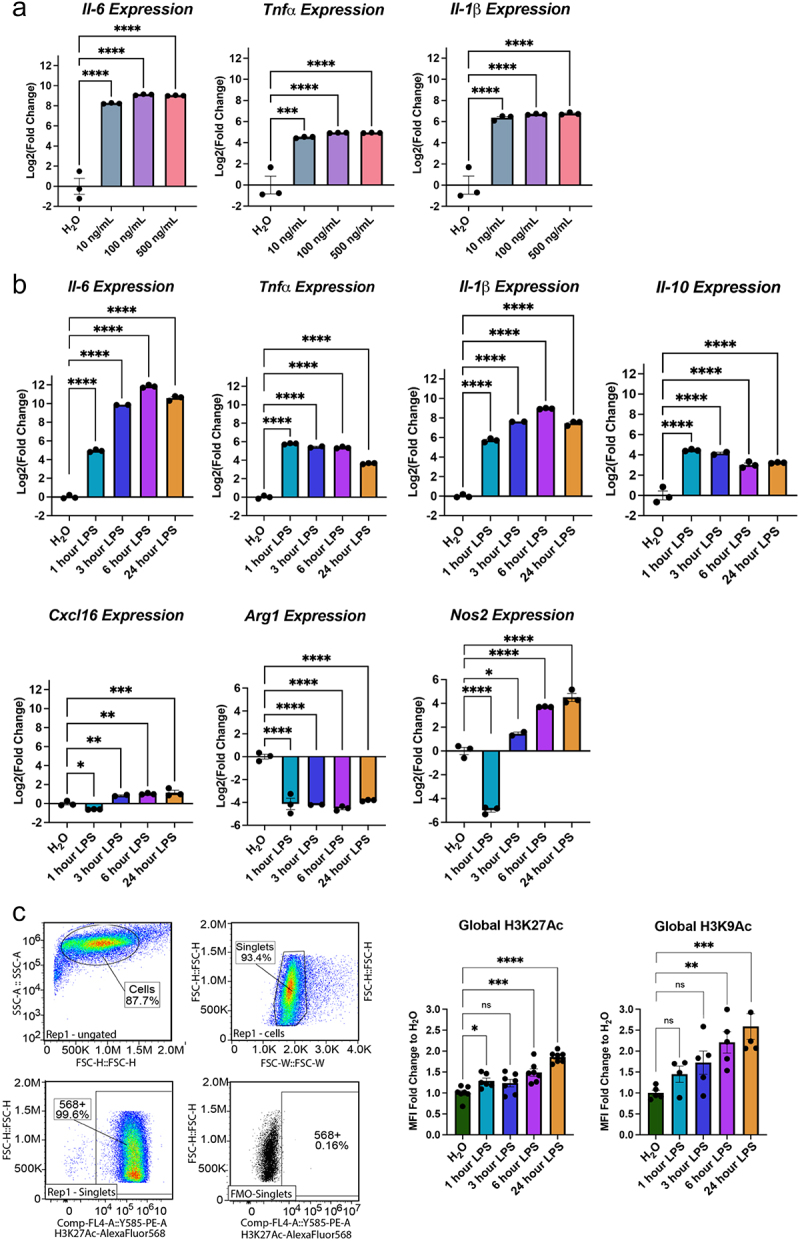
Figure 1.

BV2 Immortalized microglia robustly regulate gene expression and histone acetylation to LPS treatment. (a) RT-qPCR assessment of gene expression of Il-6, Tnfa, and Il-1b in BV2 microglia treated with different LPS doses of 10, 100, or 500 ng/mL for 3 h. Shown as bar graph of Log2(Fold Change) ± SEM Dunnett’s post hoc significances denoted (***p < 0.0002, ****p < 0.0001). (b) RT-qPCR assessment of gene expression of Il-6, Tnfa, Il-1b, Il-10, Cxcl16, Arg1, and Nos2 of BV2 microglia treated with 10 ng/mL LPS for 1, 3, 6, or 24 h. Shown as bar graph of Log2(Fold Change) ± SEM Dunnett’s post hoc significances denoted (*p < 0.03, **p < 0.002, ***p < 0.0002, ****p < 0.0001). (c) Global histone modifications by flow cytometry. Events are gated for cell size on side scatter (SSC) Area vs Forward Scatter (FSC) height and singlets on FSC-height vs FSC-width. The cells that are positive for the histone mark signal are gated based on an FMO in the same channel. The median fluorescence intensity of the positive population is exported for downstream analysis. Median fluorescent intensity (MFI) for global levels of H3K27ac levels as measured by intracellular flow cytometry. Fold Change ± SEM. Dunnett’s post hoc significances denoted (*p < 0.05, **p < 0.007, ***p < 0.0005, ****p < 0.0001). n = 2–7 replicates per condition from at least two independent sets of cultures.
