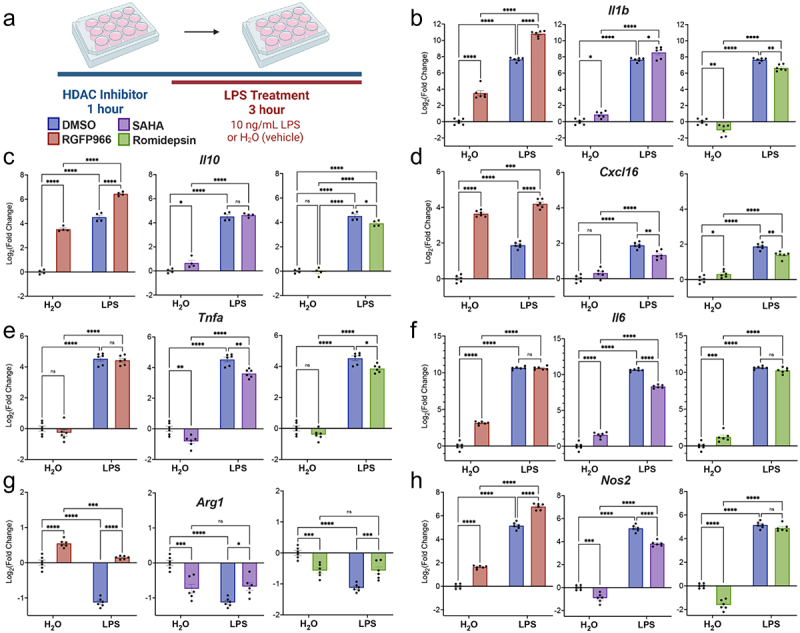
Figure 2.

Hdac inhibition modulates LPS regulated gene expression. (a) Experimental design for testing the role of Hdacs in modulating lipopolysaccharide (LPS) regulated gene expression in BV2 cultures. For all subsequent panels DMSO control is shown in blue, RGFP966 shown in red, SAHA in purple and Romidepsin in green. Each gene is depicted as three panels – DMSO vs. RGFP966, DMSO vs. SAHA, and DMSO vs. Romidepsin. (b) Il-1b, (c) Il10 and (d) Cxcl16 gene expression are enhanced by Hdac3 inhibition but not by Hdac1/2 inhibition (e) Tnfα expression is unaltered by Hdac3 inhibition but reduced by Hdac1/2 inhibition (f) Il6 expression is enhanced by Hdac3 inhibition at baseline but not in response to LPS. (g) RGFP966 blocks Arg1 repression after LPS treatment. Hdac1/2 inhibition results in the repression of Arg1 gene expression (h) Nos2 expression is increased moderately by RGFP966 both at baseline and in response to LPS. SAHA results in blunted gene expression at baseline and in response to LPS Romidepsin results blunting of Nos2 gene expression at baseline but not in response to LPS. Each panel is Log2 fold change relative to DMSO H2O and error bars are ± SEM. In all panels DMSO H2O versus DMSO LPS significance is not shown, but reaches statistical threshold (*p < 0.05) for all genes. n = 4–6 per condition in at least 3 independent cultures. *p < 0.05, **p<0.01, ***p < 0.001, ****p < 0.0001.
