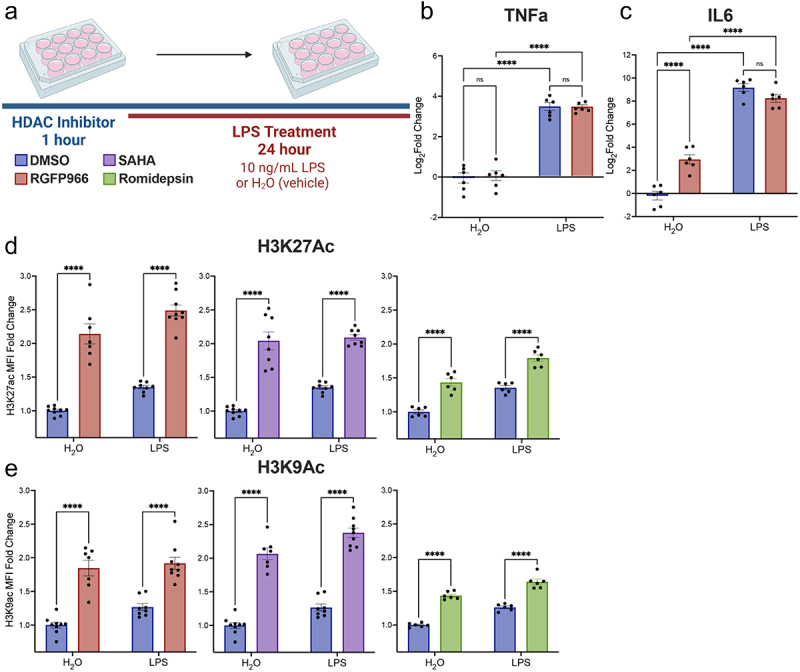
Figure 3.

Changes in cytokine release and global histone acetylation upon Hdac inhibition. (a) BV2 microglial cells were treated with DMSO, RGFP966, SAHA or Romidepsin for 1 hour and then H2O or LPS was added for 24 hours. Media was harvested for cytokine protein level assessment. Cells were then harvested, and intracellular staining was performed for H3K9ac or H3K27ac. LEGENDplex immunoassay levels of cytokine (b) Tnfα shows no impact of Hdac3 inhibition in combination with LPS. (c) Il6 protein levels were enhanced in response to Hdac3 inhibition at baseline. Graphs are depicted as log2fold change relative to DMSO H2O treated samples. n = 6 per treatment in 3 independent replication experiments. Tukey’s corrected posthocs *p < 0.05, **p < 0.005, ***p < 0.001, ****p < 0.0001. (d) Global levels of H3K27ac were increased with RGFP966, SAHA, and Romidepsin at baseline and upon LPS treatment. (e) Global levels of H3K9ac were significantly increased with RGFP966, SAHA and Romidepsin at baseline and upon LPS treatment. MFI: median fluorescence intensity. Fold change is relative to DMSO treated water samples. n = 9 per treatment in 3 independent cultures. Tukey’s corrected posthocs *p < 0.05, **p < 0.005, ***p < 0.001, ****p < 0.0001.
