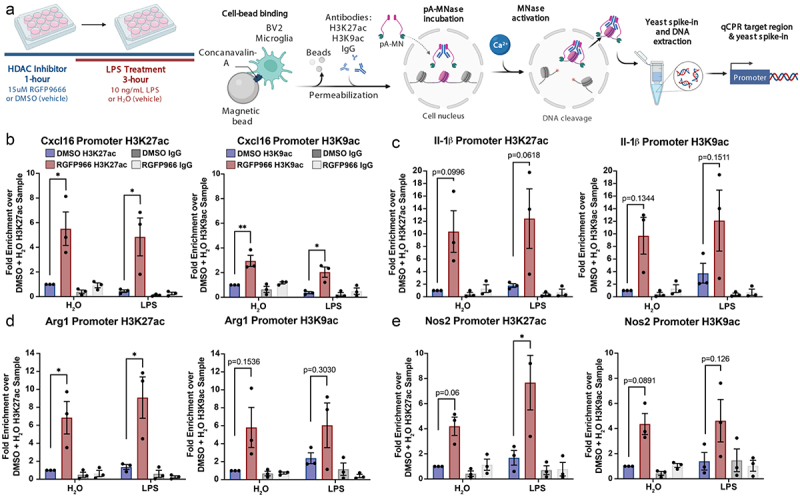
Figure 4.

Histone acetylation changes at Hdac3 modulated genes. (a) Experimental design for CUT&RUN qPCR analysis of H3K27ac and H3K9ac over promoters of key Hdac regulated target genes. All samples are normalized to yeast spike in and expressed as a percentage of input sample based on standard curve. Signal then calculated as fold enrichment relative to the H3K27ac or H3K9ac antibody levels in the DMSO and water treated control. DMSO and RGFP966 non-immune IgG samples were included for all experiments (b) H3K27ac and H3K9ac signal is significantly increased over the Cxcl16 promoter with RGFP966 treatment. (c) Trends for increased H3K27ac and H3K9ac signal with RGFP966 over the Il1-b promoter. (d) H3K27ac signal is significantly increased over the Arg1 promoter with RGFP966 treatment. H3K9ac shows similar trends but did not reach significance. (e) H3K27ac signal is significantly increased over the Nos2 promoter with RGFP966 and LPS treatment. H3K9ac shows similar trends but did not reach significance. All plots are fold enrichment with ± SEM. n = 3 per condition in independent cultures. *p < 0.05.
