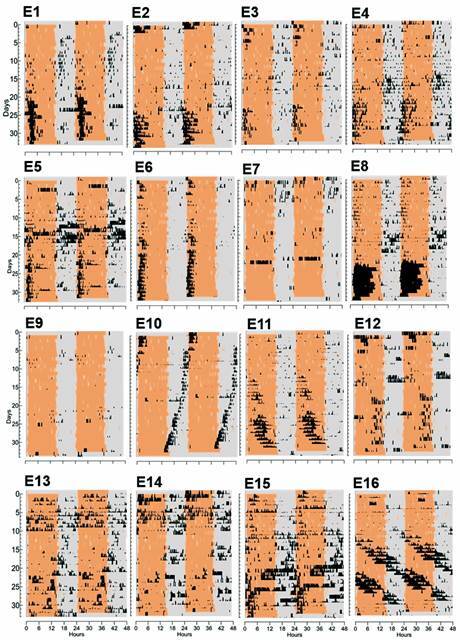
Fig. 3: individual actograms of the 16 experimental insects maintained in constant darkness (grey background) and housed in the animal room with 24 rodents. Days are represented in the left axis and a 48-hour scale in the abscissa. Black marks represent activity of the insects and the orange background, mean activity of the 24 rodents.

