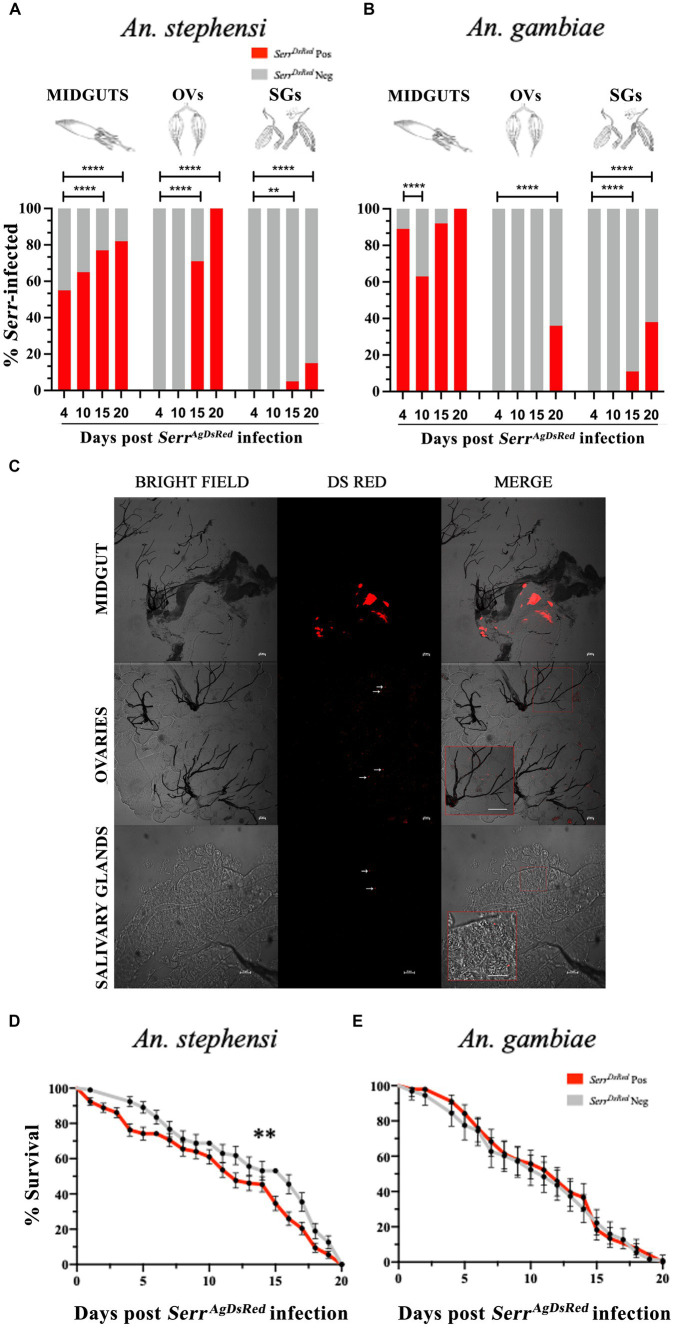
Figure 3.
Infection of midgut, ovaries and salivary glands with fluorescent labelled S. marcescens varies between different organs and between anopheline species. SerrAgDsRed -fed An. stephensi (A) and An. gambiae (B) mosquitoes were dissected at day 4, 10, 15 and 20 post infection and the percentage of SerrAgDsRed- colonized Anopheles organs were determined by fluorescence microscopy. For each organ and time point a total of 50 mosquitoes were analyzed. The values represent the average from three independent experiments. MIDGUTs is the intestinal tract, OVs: ovaries and SGs: salivary glands. To test the relationship between the presence of DsRed bacteria in different organs and time post infection, the overall infection rate (number of DsRed positive organs vs. number of DsRed negative organs) at day 4 for each organ was compared pairwise with all other time points using a Fisher’s exact test: ** < 0,01, **** < 0,0001. (C) Representative images of SerrAgDsRed colonization of gut, ovaries (scale bar 50 μm) and salivary glands (scale bar 20 μm) in An. gambiae mosquitoes on a Nikon C2-Confocal microscope. Inset images show an enlargement of the region of the original, highlighted within the red square (the scale bar in the inset is the same as that in the original). (D) Survival curves of An. stephensi and (E) An. gambiae mosquitoes infected with fluorescently labelled SerrAgDsRed added to the sugar meal for 4 days. The graphs represent the mean average ± SD of three biological replicates. Each experiment was performed with 50 adult female mosquitoes. The statistical analysis was performed using a log-rank Mantel-Cox test: ** p = 0,006.

