. 2023 Jul 7;12:RP88058. doi: 10.7554/eLife.88058

Figure 2. Structure of p110γ bound to inhibitory nanobody NB7.

(A) Domain schematics of p110γ with helical domain (blue), activation loop (orange), and regulatory motif (green) of p110γ annotated. (B) Cryo electron microscopy (cryo-EM) density of the p110γ-NB7 complex colored according to the schematic in (A). (C) Cartoon model of the structure of p110γ bound to NB7 colored according to (A). (D) Schematic depicting the key features of p110γ and the nanobody binding site, colored according to panel (A). (E) Domain schematic of NB7 complementarity determining regions (CDRs) and their sequences. (F) Zoom in on the binding interface of NB7, with the CDRs colored as in panel E, and the electron density of the CDRs contoured at 3σ (blue mesh).

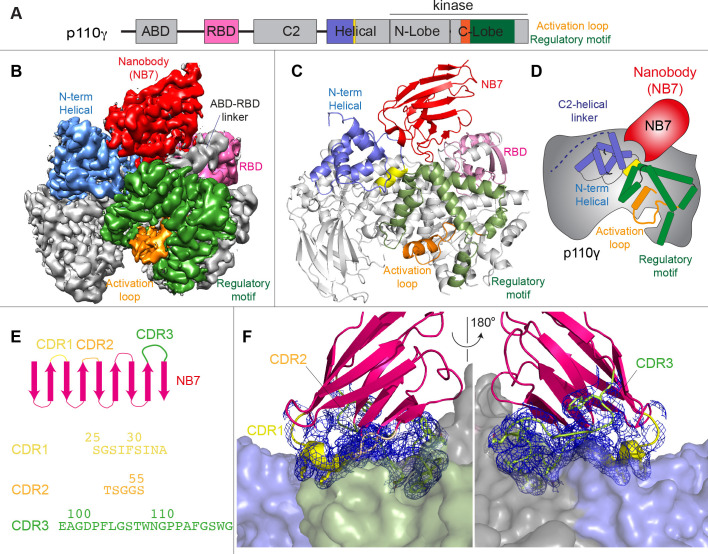
Figure 2.

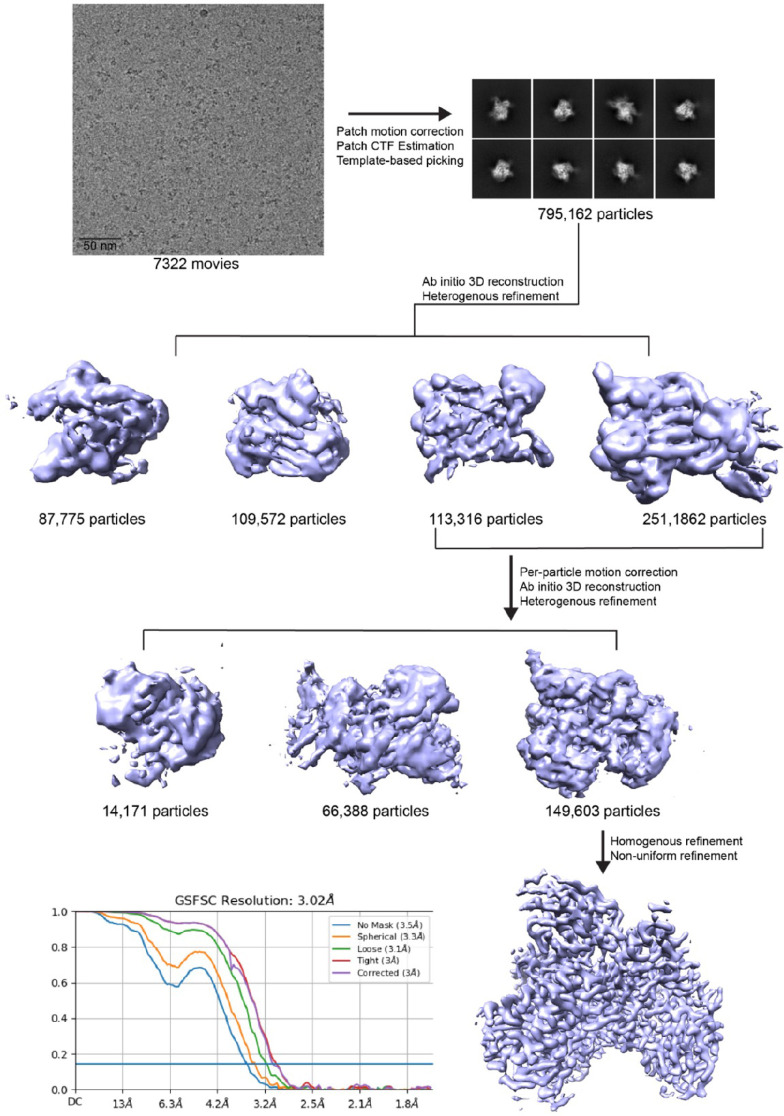
Figure 2—figure supplement 1. p110γ-NB7 complex cryo electron microscopy (cryo-EM) analysis workflow.

Figure 2—figure supplement 1.

Cryo-EM processing workflow of p110γ-NB7 complex is shown in order of a representative micrographs, representative 2D classification and 3D reconstruction processing strategy. Bottom left shows gold-standard Fourier shell correlation (FSC) curve of final round on non-uniform homogenous refinement.
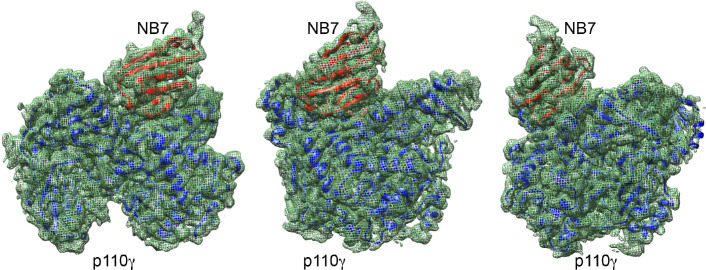
Figure 2—figure supplement 2. Density fit of p110γ-NB7 complex.

Figure 2—figure supplement 2.

Model of p110γ (blue)/NB7 (red) complex in different orientations is shown fit within the cryo electron microscopy (cryo-EM) density map (green mesh).
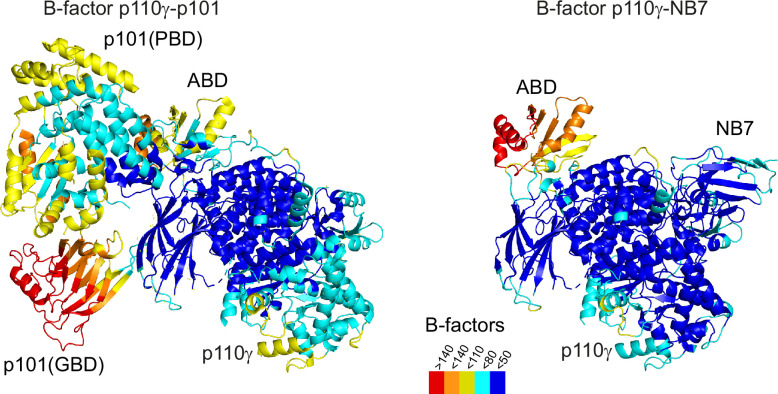
Figure 2—figure supplement 3. Comparison of full-length p110γ bound to NB7 compared to p110γ-p101.

Figure 2—figure supplement 3.

The structure of the p110γ-p101 complex (PDB: 7MEZ) compared to the NB7-p110γ complex is shown colored according to B-factor based on the legend.