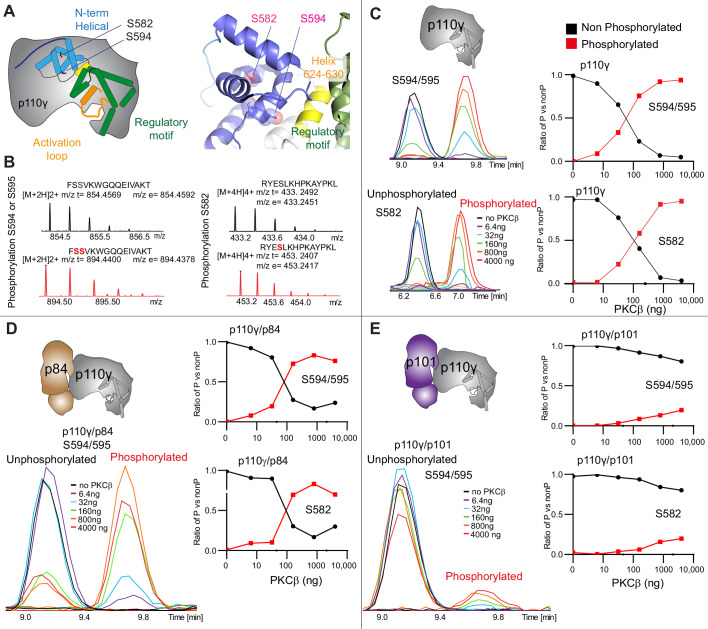
Figure 3. PKCβ leads to dual phosphorylation of internal sites in the helical domain, with selectivity for apo p110γ and p110γ-p84 over p110γ-p101.
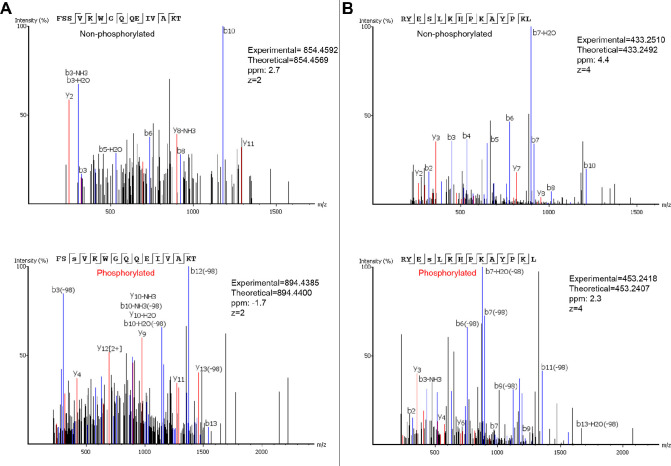
(A) Putative phosphorylation sites mapped on the structure of p110γ (PDB: 7MEZ) and cartoon schematic. The regions are colored based on domain schematics featured in Figure 2A. (B) Raw MS spectra of the unphosphorylated and phosphorylated peptide for a region spanning 579–592 (RYESLKHPKAYPKL) and 593–607 (FSSVKWGQQEIVAKT). The putative phosphorylation sites in the sequence are shown in red, with the m/z theoretical (m/z t) and m/z experimental (m/z t) shown below each sequence. (C–E) Extracted traces and ratios of the intensity of extracted ion traces of different phosphorylation site peptides (top to bottom: S594/S595 and S582) from (C) p110γ, (D) p110γ/p84, or (E) p110γ/p101 samples treated with increasing concentration of PKCβ according to the legend. The black traces in the ratio graphs are the intensity of the non-phosphorylated peptide, and the red traces in the ratio graphs are the intensity of the phosphorylated peptide.


