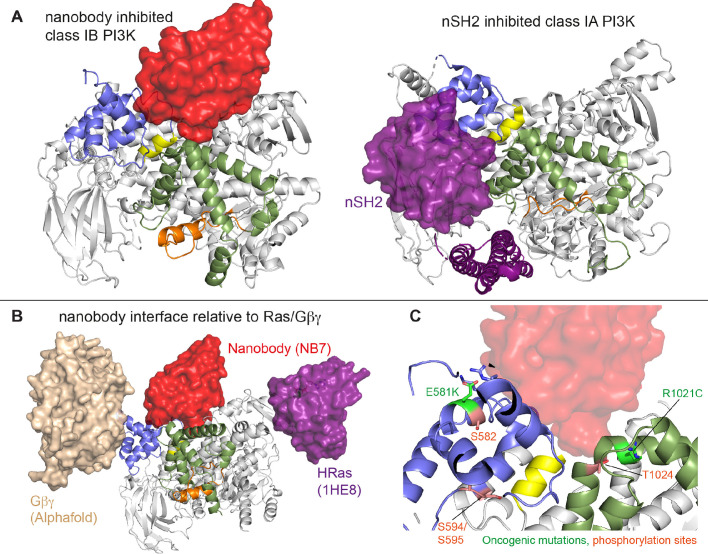
Figure 6. Comparison of nanobody binding site compared to p85 inhibition of class IA phosphoinositide 3 kinases (PI3Ks) and class IB activation sites.
(A) Comparison of the nanobody NB7 binding site in p110γ compared to the nSH2 inhibitory site in p110α (PDB: 3HHM) (Mandelker et al., 2009). (B) Comparison of the nanobody NB7 binding site in p110γ compared to the X-ray structure of the Ras binding site (PDB: 1HE8) (Pacold et al., 2000) and the Alphafold model of Gβγ bound to p110γ (Rathinaswamy et al., 2023). (C) Oncogenic mutations and post-translational modifications in spatial proximity to the nanobody binding site.

