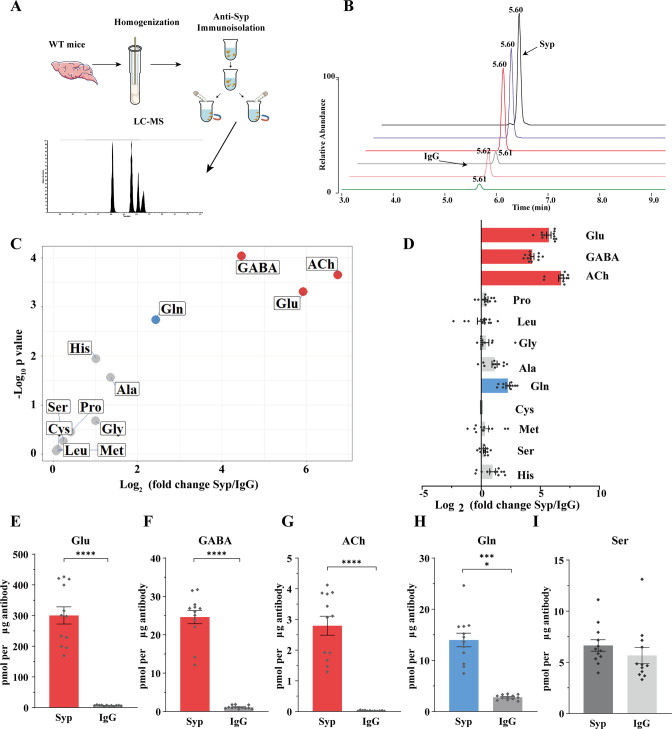
Figure 5. Presence of glutamine in synaptic vesicles (SVs) from the mouse brain.
(A) A schematic diagram illustrating the procedure to immunoisolate SVs with the anti-Syp antibody for liquid chromatography coupled to mass spectrometry (LC-MS) analysis of the contents in the SVs. (B) Representative MS results showing Gln signals from SVs immunoisolated by the anti-Syp antibody (anti-Syp) vs. the control sample immunoisolated with IgG. (C) Volcano plot of chemical contents in the SVs isolated by anti-Syp vs. IgG. The y axis shows p-values in log10 and the x axis shows the log2 of the ratio of the level of a molecule immunoisolated by anti-Syp vs. IgG. Classical neurotransmitters Glu, GABA, and ACh, as well as previously reported substrates of SLC6A17 are listed. (D) Ratios of the level of a chemical immunoisolated by anti-Syp vs. IgG (transformed into log2). (E–I) Chemicals were quantified to mole per μg antibody (n = 12 for each group from four different animals with three replicates each): Glu (E, p<0.0001 for anti-Syp vs. IgG); GABA (F, p<0.0001 for anti-Syp vs. IgG); ACh (G, p<0.0001 for anti-Syp vs. IgG); Gln (H, p<0.0001 for anti-Syp vs. IgG); Ser (I, p=0.7553 for anti-Syp vs. IgG).


