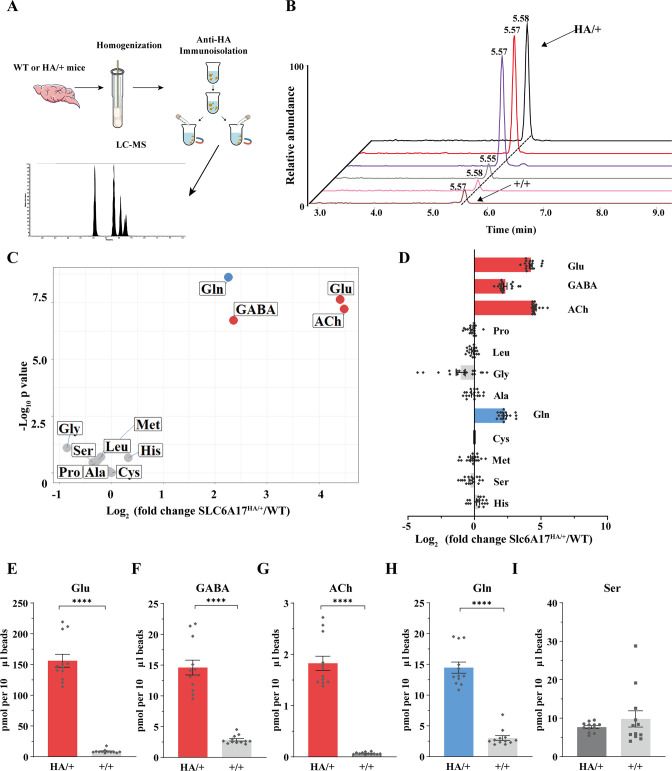
Figure 6. Glutamine (Gln) enrichment in synaptic vesicles (SVs) containing SLC6A17.
(A) A schematic diagram illustrating the procedure to isolate SLC6A17-containing SVs for chemical analysis of SV contents. (B) Representative result showing MS Gln signals in SVs immunoisolated by the anti-HA beads in Slc6a17HA/+ mice vs. those from Slc6a17+/+ mice. (C) Volcano plot of chemical contents in the SVs immunoisolated by anti-HA beads from Slc6a17HA/+ mice vs. Slc6a17+/+ mice. The y axis shows p-values in log10 and the x axis shows the log2 of the ratio of the level of a molecule immunoisolated by anti-HA beads from Slc6a17HA/+ mice vs. that from Slc6a17+/+ mice. Classical neurotransmitters such as Glu, GABA, and ACh as well as the previously reported substrates of SLC6A17 are listed. (D) Ratios of the level of a chemical immunoisolated by anti-HA beads from Slc6a17HA/+ mice vs. that from Slc6a17+/+ mice (transformed into log2). (E–I) Contents of SLC6A17-containing SVs were quantified to mole per 10 μl anti-HA beads (n = 12, for each group from four different animals with three replicates each): Glu (E, p<0.0001 for Slc6a17HA/+ vs. Slc6a17+/+); GABA (F, p<0.0001 for Slc6a17HA/+ vs. Slc6a17+/+); ACh (G, p<0.0001 for Slc6a17HA/+ vs. Slc6a17+/+); Gln (H, p<0.0001 for Slc6a17HA/+ vs. Slc6a17+/+); Ser (I, p=0.7553 for Slc6a17HA/+ vs. Slc6a17+/+).

