. 2023 Jul 19;12:RP87714. doi: 10.7554/eLife.87714

Figure 1. Biochemical analysis of the association between histone variants and histone marks.

(A) Histones H3.1 and H3.3 form homotypic and heterotypic nucleosomes. Spectral counts of H3.1- and H3.3-specific peptides in the respective immunoprecipitations (T – transgenic, E – endogenous H3.1 and H3.3). (B) H2A variants do not preferentially associate with H3.1- or H3.3-containing nucleosomes. HA-tagged H3.1 and H3.3 mononucleosomes were immunoprecipitated with HA agarose and analyzed for the presence of H2A variants by immunoblotting. (C) Histone H3 marks are present on both H3.1 and H3.3. HA-tagged H3.1 and H3.3 mononucleosomes were immunoprecipitated with HA agarose and analyzed for the presence of H3 marks by immunoblotting. Arrows indicate transgenic (T) and endogenous (E) H3. (D) Mass spectrometry (MS) analysis of cumulative H3K27, H3K36, and H3K37 modifications on H3.1 and H3.3. All measured spectra corresponding to H3.1 and H3.3 peptides from both IPs were used for analysis. (E) Relative abundance of H3K27, H3K36, and H3K37 modifications on H3.1 variant analyzed separately from MS data of H3.1 and H3.3 purified nucleosomes (left panel). Relative abundance of H3K27, H3K36, and H3K37 modifications on H3.3 variant analyzed separately from MS data of H3.1 and H3.3 purified nucleosomes (right panel). (F) Co-occurrence of H2A variants and H3 marks. Mononucleosomes were immunoprecipitated with the indicated antibodies and analyzed for the presence of H2A variants and H3 marks by western blotting. Original pictures of the gels are provided in Figure 1—source data 1, Figure 1—source data 2 and Figure 1—source data 3.

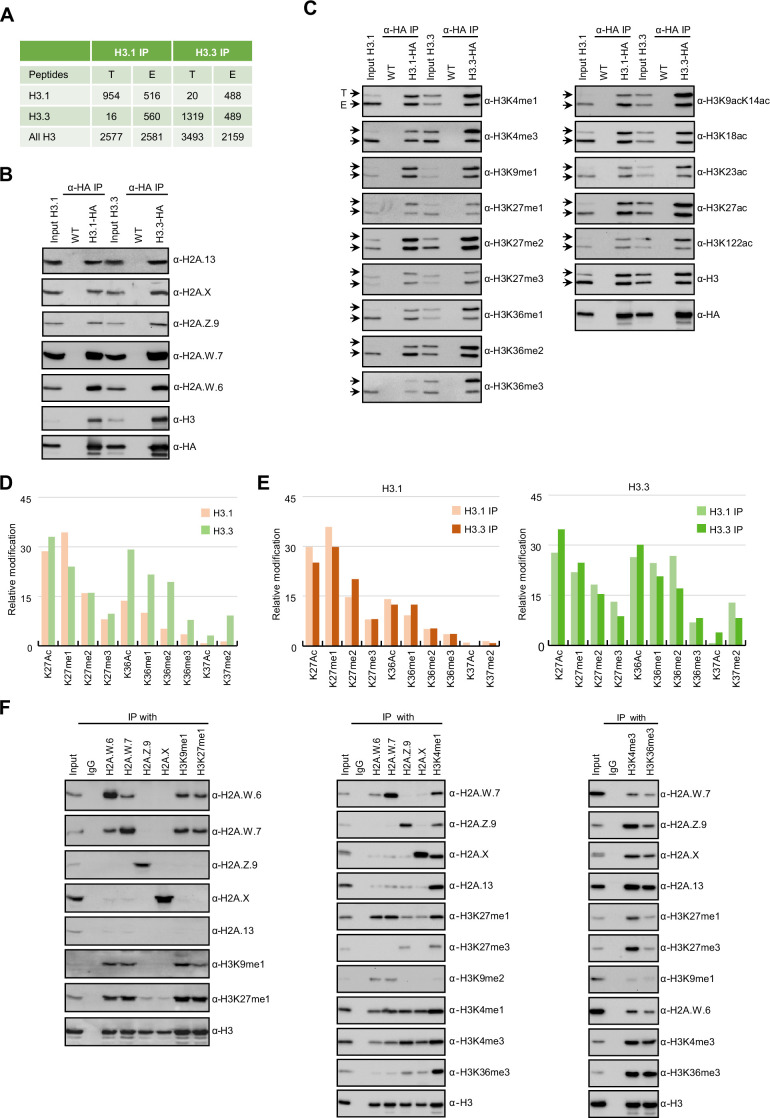
Figure 1—source data 1.
Figure 1—source data 2. The data contains the orginal images of the gels.
Figure 1—source data 3. The data contains the orginal images of the gels.

Figure 1.

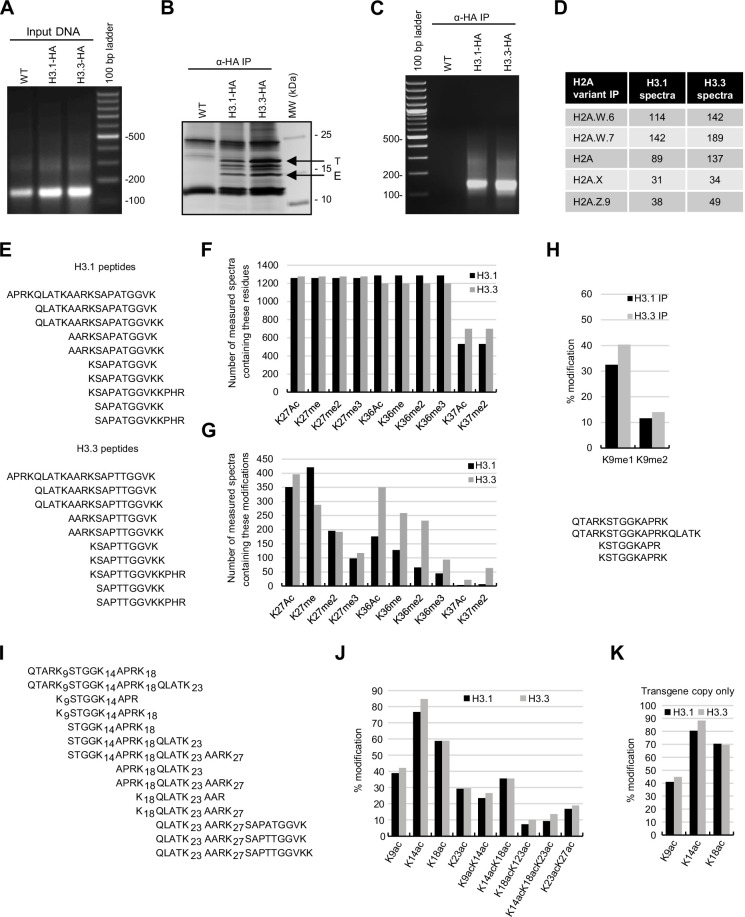
Figure 1—figure supplement 1. Biochemical analysis of the association between histone variants and histone marks.

Figure 1—figure supplement 1.

(A) Analysis of DNA in input samples used for H3.1 and H3.3 mononucleosome immunoprecipitation after MNase digestion. (B) Silver-stained 8–20% gradient gel of immunoprecipitated H3.1 and H3.3 mononucleosomes. Arrows indicate transgenic (T) and endogenous (E) H3 proteins. Molecular weight markers are indicated on the right. (C) Analysis of DNA extracted from immunoprecipitated H3.1 and H3.3 mononucleosomes. (D) Spectral counts of H3.1- and H3.3-specific peptides (as indicated in panel E) in mononucleosomes immunoprecipitated with H2A variant-specific antibodies. (E) H3.1- and H3.3-specific peptides were used for the analysis of H3K27, H3K36, and H3K37 modifications. (F) Number of MS-measured spectra that covered the indicated residues in H3.1 and H3.3 mononucleosomes. (G) Number of measured MS spectra containing the indicated modifications in H3.1 and H3.3 mononucleosomes. (H) (top) Relative methylation levels of H3K9me1 and H3K9me2 on H3.1 and H3.3 were revealed from transgenic copies of the respective H3 variants. (bottom) Sequences of peptides used to evaluate H3K9me1 and H3K9me2 by MS. (I) Sequences of peptides used to evaluate H3 acetylation by MS. (J) Relative acetylation levels of the indicated H3 residues in immunoprecipitated H3.1 and H3.3 mononucleosomes without differentiating H3.1 and H3.3 variants. (K) Relative acetylation levels of the indicated H3 residues on H3.1 and H3.3 were revealed from transgenic copies of the respective H3 variants. Original pictures of the gels are provided in Figure 1—figure supplement 1—source data 1.
Figure 1—figure supplement 1—source data 1. The data contains the orginal images of the gels.