. 2023 Jul 19;12:RP87714. doi: 10.7554/eLife.87714

Figure 2. Histone variants define chromatin states in Arabidopsis thaliana.

(A) Bubble plot showing the emission probabilities for histone modifications/variants across the 26 chromatin states. (The size of the bubble represents the emission probability ranging from 0 to 1). The colors are ascribed for each type of chromatin. (B) Stacked bar plot showing the overlap between annotated genomic features and chromatin states. (C) Box plot showing the expression of protein-coding genes overlapping with each chromatin state in Transcripts per Million (TPM). (D) Box plot showing levels of CG methylation across chromatin states. (E) Box plot comparing DNase I-seq read coverage across chromatin states representing chromatin accessibility. (F) Heatmap showing the Jaccard similarity index between the states generated using the whole model and states using a subset of marks, i.e., excluding a set of marks and variants as indicated on the x-axis. The comparison with a 9-state model (Sequeira-Mendes et al., 2014) did not include CG content, DNA methylation, H4K5ac, and H3K4me2 which were not used in the 26-state model. H2B did not seem to make a significant contribution. Excluding H3 did reduce effectively the Jaccard index for both the 26 and the 9 chromatin states model, which both included H3.1 and H3.3. The major differences between the 26 and the 9 chromatin states model are in the intergenic states. Overall H2A variants affected most strongly the Jaccard index.

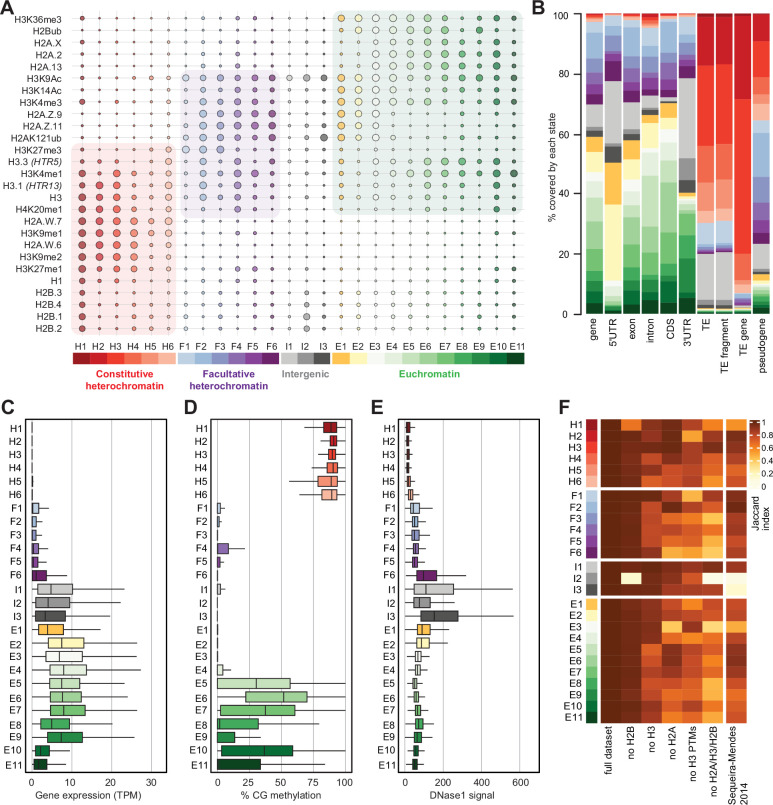
Figure 2—source data 1. This source data contain the original pictures of the gels.

Figure 2.

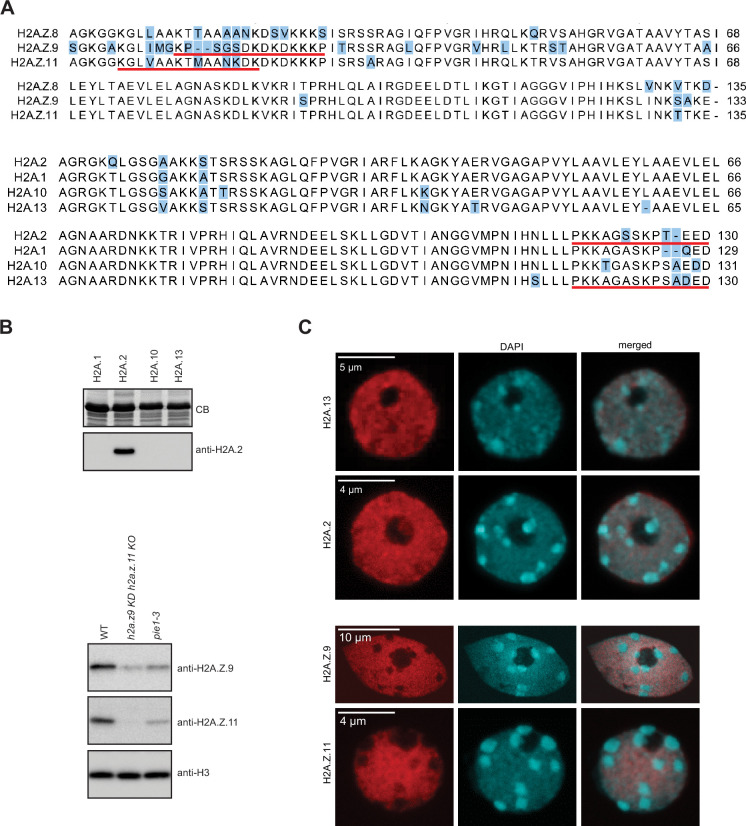
Figure 2—figure supplement 1. Validation of H2A.2 and H2A.

Figure 2—figure supplement 1.

Z.11 polyclonal antibodies. (A) Sequence alignments of three H2A.Z and four H2A histone variants. Positions that differ between variants are highlighted in blue. Underlined are sequences of peptides used for immunization. (B) Antibodies against H2A.2 were tested with four H2A variants expressed in bacteria. Relevant part of Coomassie stained gel with overexpressed H2As is shown on the top. As shown on the bottom panel antibody raised against H2A.2 peptide recognized only H2A.2. Antibodies against H2A.Z.11 were tested on nuclear extracts from WT, h2a.z.9 knock-down/h2a.z.11 knock out (h2a.z.9 KD h2a.z.11 KO; this line still expresses H2A.Z.8), and pie1-3 (mutant in the large subunit of the SWR1 complex responsible for the deposition of H2A.Z) lines. The H2A.Z.11 antibodies did not recognize any protein in the h2a.z.9 KD h2a.z.11 KO line indicating its specificity. In pie1-3 line, both H2A.Z.9 and H2A.Z.11 were detected but at reduced levels as compared to WT which is in line with the inefficient deposition of H2A.Z in the absence of SWR1. The H3 antibody served as the loading control. (C) Immunostaining of WT nuclei with indicated antibodies. Original pictures of the gels are provided in Figure 2—figure supplement 1—source data 1.
Figure 2—figure supplement 1—source data 1. This source data contain the original pictures of the gels.
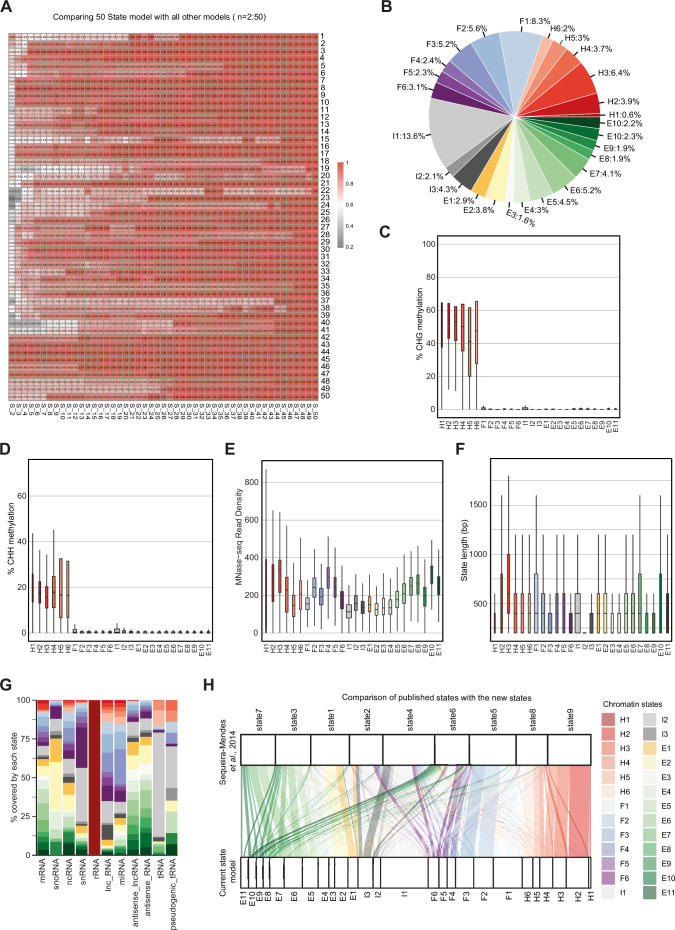
Figure 2—figure supplement 2. Properties of chromatin states in Arabidopsis thaliana.

Figure 2—figure supplement 2.

(A) Heatmap showing the correlation (0–1) between emission parameters of each model. The y-axis represents the distinct states in the reference state model (n=50). The x-axis represents models including 2–49 states compared to the 50-state model. The correlation plotted here is the maximum correlation between each state of the reference model and any state of the other models being compared. (B) Pie chart showing the proportion of the genome covered by each state. (C, D) Box plots showing levels of CHG (C) and CHH (D) methylation across states. (E) Box plot showing nucleosome occupancy (MNase-seq read density) across states. (F) Box plots showing the length (bp) of chromatin states. (G) Stacked bar plot showing the overlap between non-protein-coding gene features and chromatin states. (H) Flow diagram showing the overlap (in bp) between published states (Sequeira-Mendes et al., 2014) and the current states. The color code for the flow diagram represents the chromatin states in the current model.