. 2023 Jul 19;12:RP87714. doi: 10.7554/eLife.87714

Figure 3. Decreased in DNA Methylation (DDM1) loss of function disrupts chromatin states in Arabidopsis thaliana.

(A) Heatmap showing the emission probability for each mark/variant across the 16 chromatin states of the concatenated wild-type and ddm1 mutant model. The bar plot on the left represents the proportion of the genome covered by each state in wild-type (green) and in ddm1 (red). (B) Bar plot showing the Jaccard indices between the state assignments in wild-type and ddm1 mutant. (C) Bar plot showing the state assignment overlap between the wild-type and ddm1 for each chromatin state. The red vertical line represents the genome-wide overlap (62.2%). (D) Bar plot showing the log2 fold changes of the proportion of genome covered by each state across the ddm1 genome compared to the wild-type. (E) Stacked bar plot showing the overlap between annotated genomic features and chromatin states from the concatenated model in wild-type. (F) Stacked bar plot showing the overlap between annotated genomic features and chromatin states from the concatenated model in ddm1 mutant. (G) DDM1 interaction with H2A.W and H2A.Z. Coomassie-stained 15% SDS-PAGE gel showing input protein samples (top panel) used for in vitro pull-down (bottom panel) with His6-tagged DDM1 and histone dimers. The lane ΔCTH2A.W shows that the deletion of the C-terminal tail of H2A.W does not influence binding to DDM1. (H) Summary of the pull-down assays to identify regions in DDM1 binding to H2A.W and H2A.Z. Blue and purple boxes indicate the H2A.W binding regions in DDM1 identified by previous work (Osakabe et al., 2021). Original pictures of the gels are provided in Figure 3—source data 1.

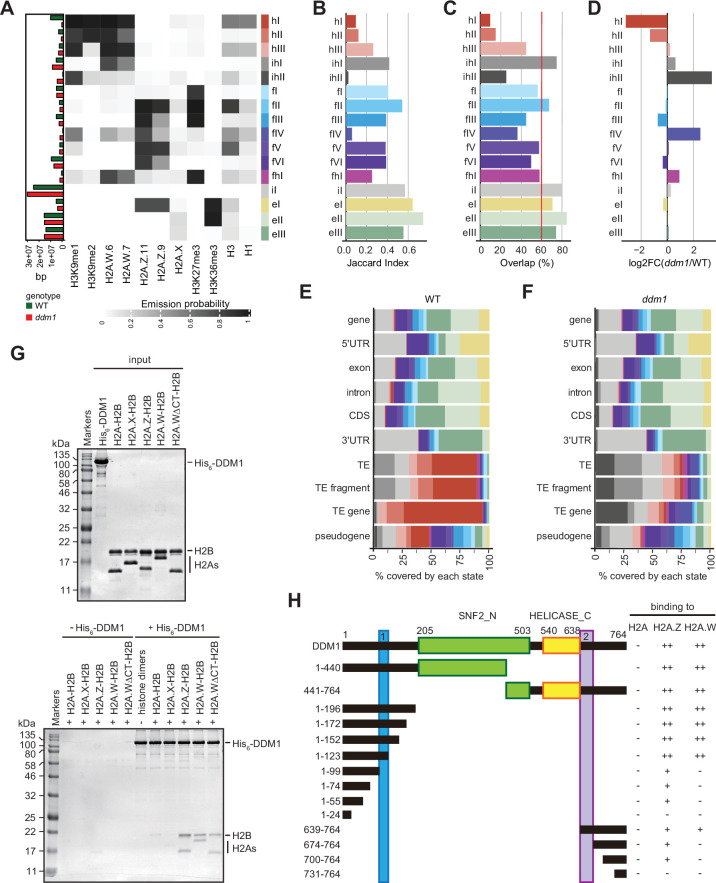
Figure 3—source data 1. The data contains the orginal images of the gels.

Figure 3.

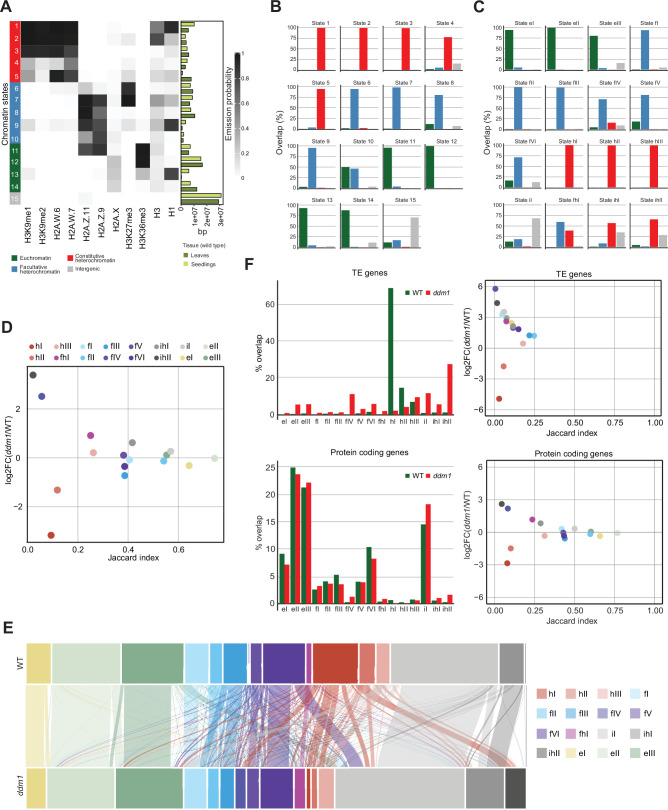
Figure 3—figure supplement 1. Decreased in DNA Methylation (DDM1) loss of function disrupts chromatin states in Arabidopsis thaliana.

Figure 3—figure supplement 1.

(A) Heatmap showing the emission probability of histone mark/variant across the 15 chromatin states of the concatenated model computed with chromatin profiles from seedlings and leaves. The bar plot on the right represents the proportion of the genome covered by each state in seedlings (light green) and in leaves (dark green). (B) Bar plots of the genomic overlap between the seedling and leaf concatenated model states and states from the four chromatin types in the 26-state model. 14 states show overlaps with predominantly one chromatin type, whereas only state 10 overlaps with two types in similar proportions. (C) Bar plots of the genomic overlap between the wild-type and ddm1 concatenated model states and states from the four chromatin types in the 26-state model. 13 states overlap with predominantly one chromatin type, whereas 3 states overlap with two types. In (B) and (C), color codes for four major groups of chromatin states are as in panel (A). (D) Scatter plot of the Jaccard index vs. the log2 fold change in the proportion of the genome for the 16 states from the wild-type and ddm1 concatenated model. For each state, the Jaccard index was calculated for the genomic regions covered in wild-type and in ddm1. The log2 fold change was calculated using the total number of base pairs covered by each state in ddm1 mutant compared to in the wild-type (see also methods). (E) Alluvial plot showing the chromatin state changes between the wild-type (top row) and ddm1 (bottom row). The plot was generated using the R package ggalluviel v0.12.5 (Brunson and Read, 2020). (F) Scatter plots of the Jaccard index vs. the log2 fold change in the proportion of genome for the 16 states from the wild-type and ddm1 concatenated model (see D and Methods) for TE genes and protein coding genes separately (right panels). In addition, the percentages of the combined length of the TE/protein-coding genes covered by each state are shown as bar plots on the left. Color codes for chromatin states are as in panel (D).
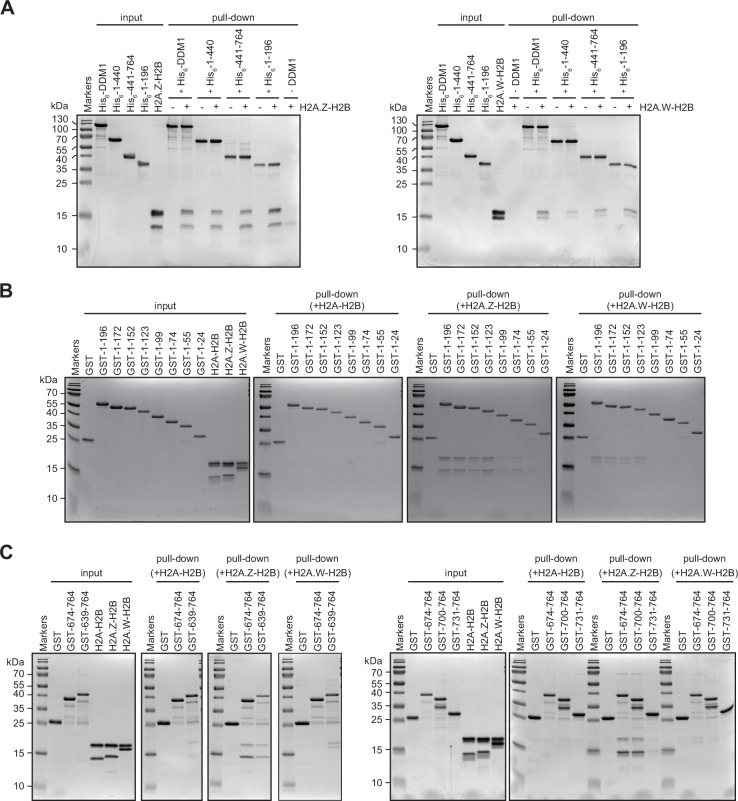
Figure 3—figure supplement 2. Interaction of Decreased in DNA Methylation (DDM1) and DDM1 deletion mutants with histone variants.

Figure 3—figure supplement 2.

(A–C) Identification of H2A.W and H2A.Z binding sites in DDM1. His6- (A) or GST- (B and C) tagged DDM1 fragments, as indicated with amino acids numbers, were incubated with indicated H2A-H2B dimers and after washing samples were analyzed on 15% SDS-PAGE and stained with Coomassie. Original pictures of the gels are provided in Figure 3—figure supplement 2—source data 1.
Figure 3—figure supplement 2—source data 1. The souce data file contain the original pcitures of the gels.