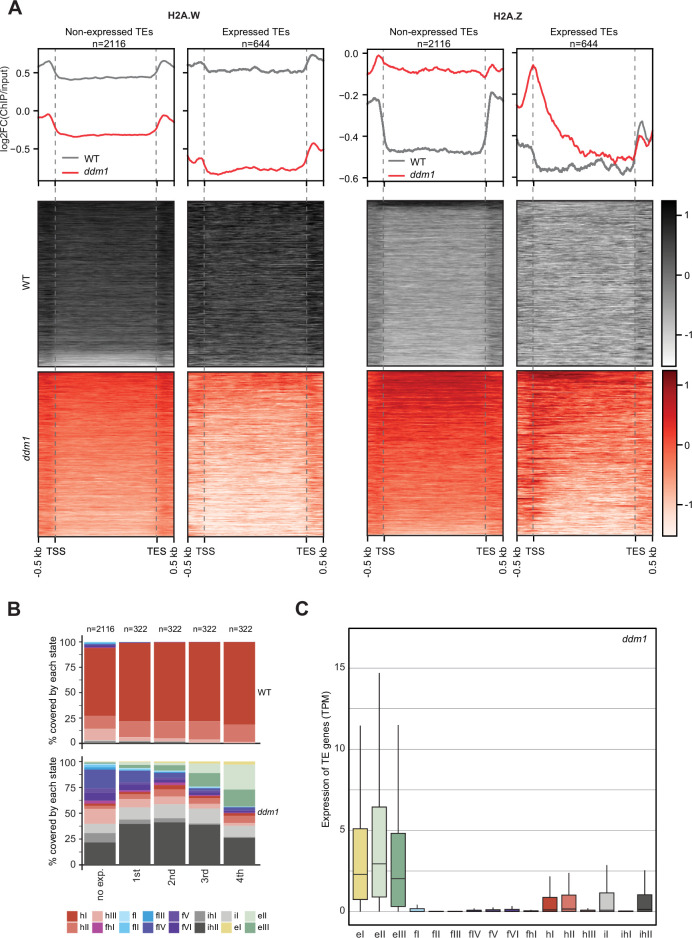
Figure 4. Impact of expression on chromatin states over TE genes in ddm1.
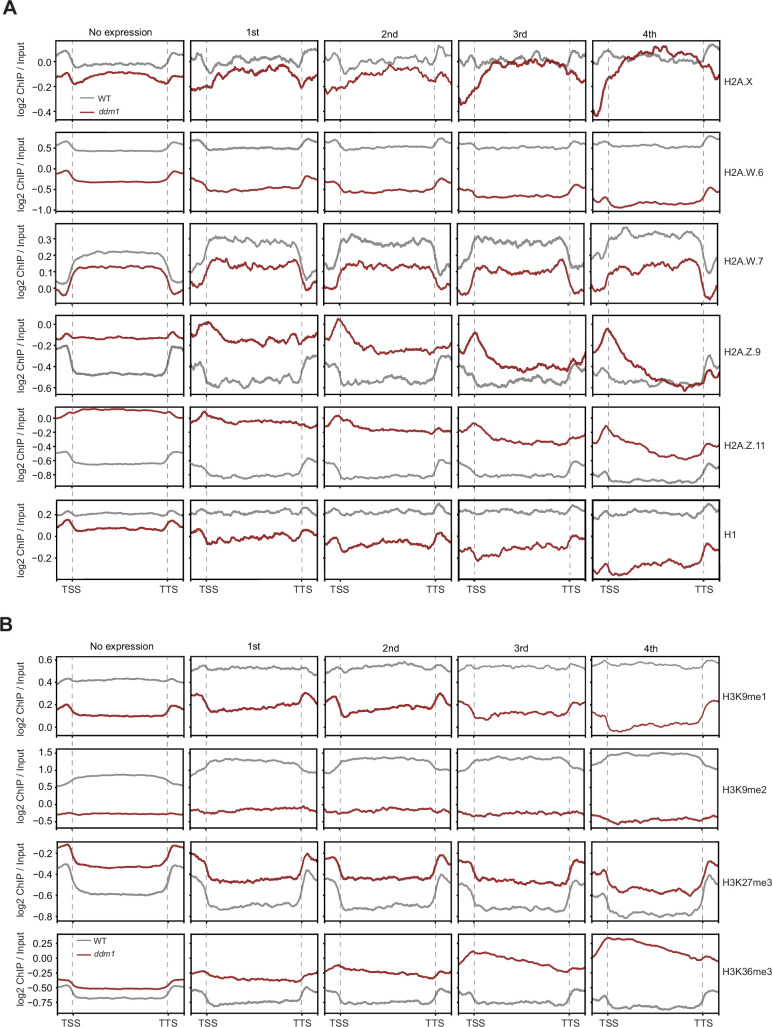
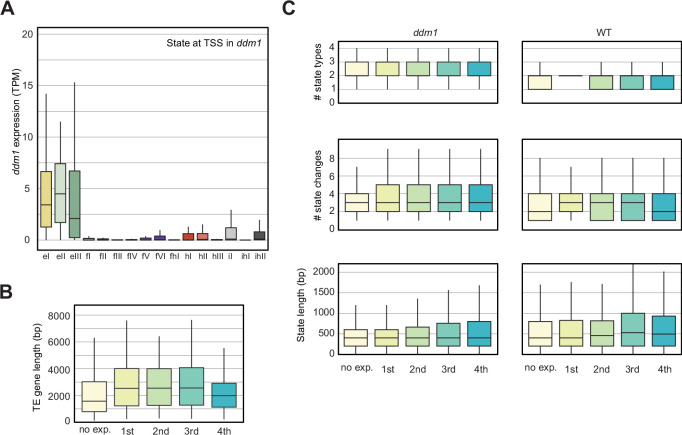
(A) Enrichment profiles of H2A.W.6 and H2A.Z.9 over TE genes in ddm1. TE genes were grouped by expression in ddm1 mutant. Out of the 3901 TE genes in the Arabidopsis genome annotation, 497 were excluded because they showed expression in wild-type, 2116 TE genes showed no expression in ddm1 (non-expressed TE genes) while 1288 TE genes were expressed. Because many of these TE genes showed very low expression levels, we divided the expressed TEs into 4 quartiles (322 TE genes each) based on their expression values where the 1st quartile contains TE genes with the lowest expression and the 4th quartile contains TE genes with the highest expression. Given that the TE genes in 1st and 2nd quartile showed nominal expression values, we placed only TE genes in 3rd and 4th quartile (644 TE genes) in the category of expressed TEs. n represents the number of TE genes in each group. (B) Stacked bar plots of the proportion of states in wild-type (top panel) and in ddm1 (bottom panel) overlapping TE genes grouped by expression in ddm1. (C) Box plot showing the expression of TE genes overlapping the 16 concatenated model states in ddm1.


