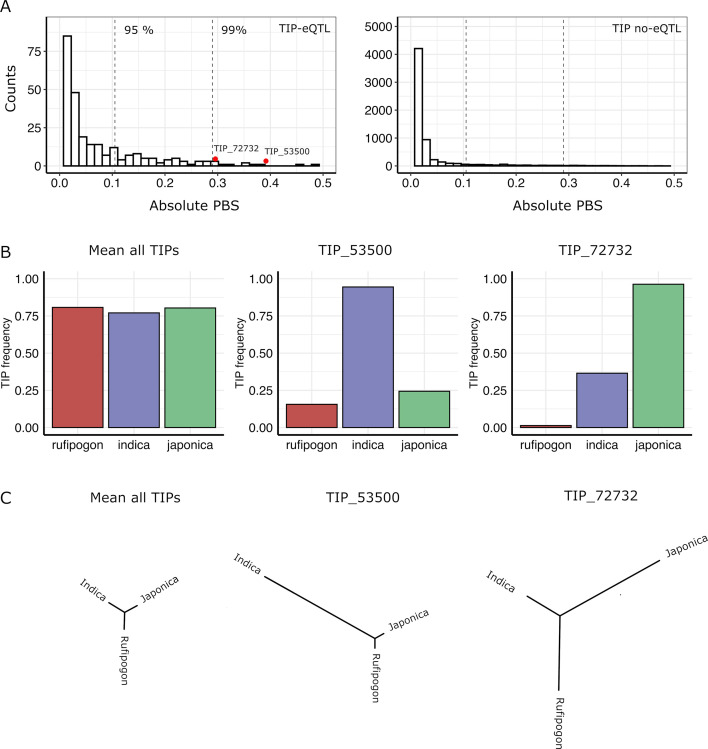
Figure 3. Signatures of positive selection on transposon insertion polymorphism (TIP)-expression quantitative trait loci (eQTLs).
(A) Absolute Population Branch Statistic (PBS) of 354 TIP-eQTLs (left) and 11,344 TIPs (no-eQTL, right) present in indica, japonica, and rufipogon populations. Dotted vertical lines represent the 95th and 99th percentiles of the PBS values of the whole dataset (11,698 TIPs). Red dots represent two examples of TIP-eQTLs with extreme PBS values. (B) Population frequency of the two TIPs with extreme PBS values, marked as red dots in the left panel (A), as well as of the whole TIP dataset. (C) Fst-based tree of the two TIPs with extreme PBS values, as well as of the whole TIP dataset (average Fst).

