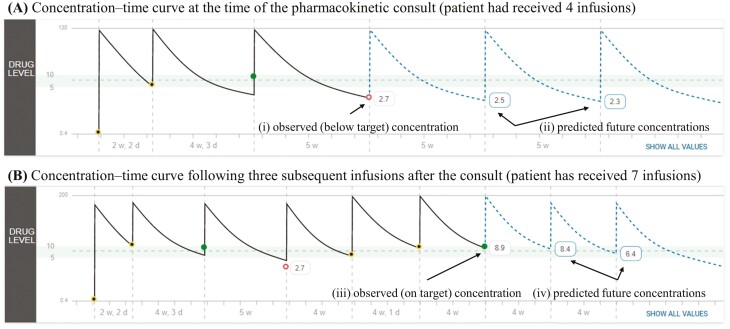
Figure 2.
Real-world use of the maintenance PK dashboard highlighting the utility of model-informed precision dosing for patients found to have rapid drug clearance. The patient’s (A) observed (solid line) concentration-time curve, observed concentration (2.7 µg/mL) and the predicted (dashed-line) future concentrations at the time of the consult. (B) The patient’s observed concentration-time curve and the measured infliximab concentration (8.9 µg/mL) at the third infusion after the consult. The shaded region in each panel represents the targeted trough concentration range (5-10 µg/mL) during infliximab maintenance.

