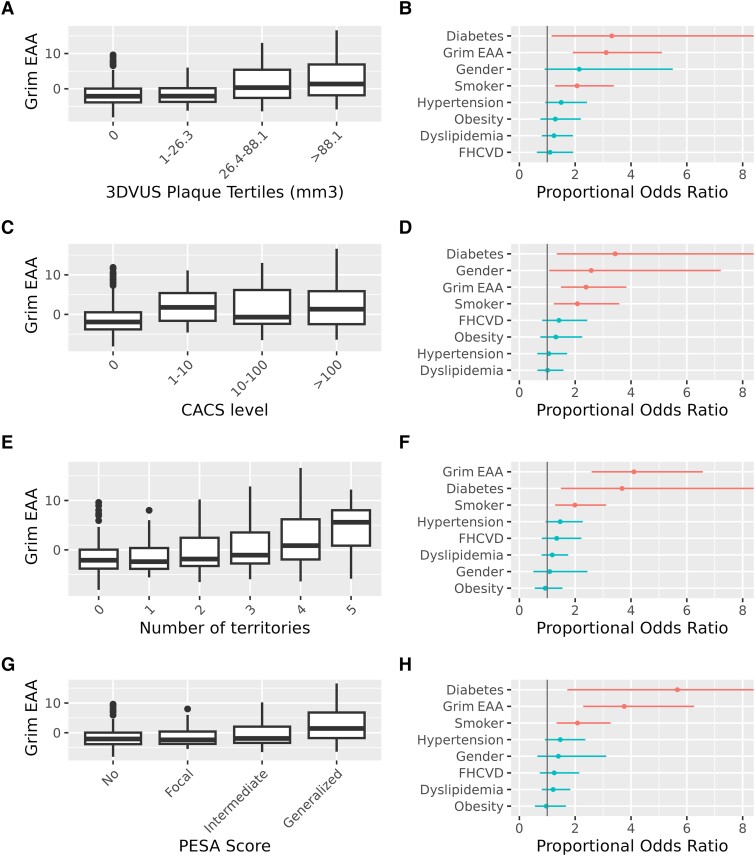
Figure 2.
Progression of Early Subclinical Atherosclerosis participants with larger extension of subclinical atherosclerosis have accelerated grim epigenetic age. a–h boxplots (A, C, E, G) and forest plots (B, D, F, H) for the ordinal logistic regression of the extension of subclinical atherosclerosis and Grim epigenetic age acceleration. Subclinical atherosclerosis was assessed using different metrics and imaging techniques: 3DVUS plaque volume (A, B), calcification of coronary arteries by computed tomography (C, D); number of territories with plaques detected by 2DVUS (E, F), and Progression of Early Subclinical Atherosclerosis score (G, H). Models were adjusted by diabetes, gender, smoking, dyslipidemia, obesity, family history of CVD, and hypertension. Jonckheere-Terpstra test for trend <0.001 for all comparisons in panels (A, C, E, G). Forest plots in panels (B, D, F, H) display the proportional Odds Ratio of the ordinal logistic regression model and its 95% Confidence Interval. EAA, epigenetic age acceleration; CACS, coronary artery calcium score; PESA, Progression of Early Subclinical Atherosclerosis.

